Acer 2005 Annual Report Download - page 19
Download and view the complete annual report
Please find page 19 of the 2005 Acer annual report below. You can navigate through the pages in the report by either clicking on the pages listed below, or by using the keyword search tool below to find specific information within the annual report.
- 14 -
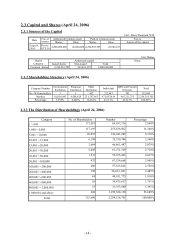
2.3 Capital and Shares (April 24, 2006)
2.3.1 Sources of the Capital
Unit: Share/Thousand NT$
Authorized Common stock Paid-in Common stock Note s
Date Price of
Issuance Shares Value Shares Value Source of the capital
August,
2005
Share/
NT$10 2,800,000,000 28,000,000 2,254,518,705 22,545,187
Unit: Shares
Authorized capital
Shares
Category Issued shares Non-issued Total
Notes
Common shares 2,254,518,705 545,481,295 2,800,000,000
2.3.2 Shareholding Structure (April 24, 2006)
Category/Number Government
Institution
Financial
Institution
Other
Institution Individual QFII and Foreign
Investors Total
No. Of Shareholders 3 5 457 322,443 782 323,690
Number 81,056,843 4,508,628 231,787,665 971,953,814 965,211,755 2,254,518,705
Percentage 3.595% 0.200% 10.281% 43.111% 42.813% 100.00%
2.3.3 The Distribution of Shareholdings (April 24, 2006)
Category No. of Shareholders Number Percentage
1~999 171,593 64,657,176 2.868%
1,000~5,000 117,195 255,838,502 11.348%
5,001~10,000 20,053 142,441,282 6.318%
10,001~15,000 6,198 75,750,784 3.360%
15,001~20,000 2,664 46,861,487 2.079%
20,001~30,000 2,495 61,271,329 2.718%
30,001~50,000 1,533 59,235,493 2.627%
50,001~100,000 972 67,524,668 2.995%
100,001~200,000 406 57,615,641 2.556%
200,001~400,000 196 56,033,192, 2.485%
400,001~600,000 84 40,931,775 1.816%
600,001~800,000 58 39,475,637 1.751%
800,001~1,000,000 35 31,353,589 1.391%
1,000,001 and above 208 1,255,528,150 55.689%
Total 323,690 2,254,518,705 100.000%


