Acer 2005 Annual Report Download - page 74
Download and view the complete annual report
Please find page 74 of the 2005 Acer annual report below. You can navigate through the pages in the report by either clicking on the pages listed below, or by using the keyword search tool below to find specific information within the annual report.-
 1
1 -
2
-
3
-
4
-
5
-
6
-
7
-
8
-
9
-
10
-
11
-
12
-
13
-
14
-
15
-
16
-
17
-
18
-
19
-
20
-
21
-
22
-
23
-
24
-
25
-
26
-
27
-
28
-
29
-
30
-
31
-
32
-
33
-
34
-
35
-
36
-
37
-
38
-
39
-
40
-
41
-
42
-
43
-
44
-
45
-
46
-
47
-
48
-
49
-
50
-
51
-
52
-
53
-
54
-
55
-
56
-
57
-
58
-
59
-
60
-
61
-
62
-
63
-
 64
64 -
 65
65 -
 66
66 -
 67
67 -
 68
68 -
 69
69 -
 70
70 -
 71
71 -
 72
72 -
 73
73 -
 74
74 -
 75
75 -
 76
76 -
 77
77 -
 78
78 -
 79
79 -
 80
80 -
 81
81 -
 82
82 -
 83
83 -
 84
84 -
85
-
86
-
87
-
88
-
89
 |
 |
- 69 -
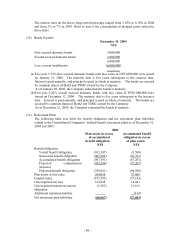
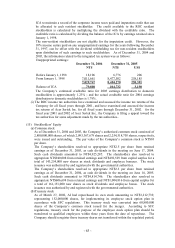
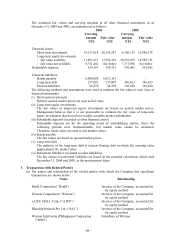
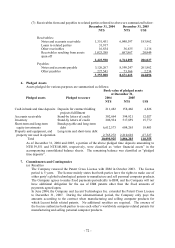
The estimated fair values and carrying amounts of all other financial instruments as of
December 31, 2004 and 2005, are summarized as follows:
2004 2005
Carrying
amount
Fair value
Carrying
amount
Fair value
NT$ NT$ NT$ NT$
Financial assets:
Short-term investments 16,157,618 20,559,287 6,160,138 10,546,378
Long-term equity investments
- fair value available 11,893,157 13,956,192 10,232,075 18,989,721
- fair value not available 8,751,442 See below 7,373,898 See below
Refundable deposits 539,191 539,191 501,042 501,042
Financial liabilities:
Bonds payable 6,000,000 6,027,391 - -
Long-term debt 257,007 257,007 146,623 146,623
Pension liabilities 94,270 94,270 103,620 103,620
The following methods and assumptions were used to estimate the fair value of each class of
financial instruments:
(i) Short-term investments
Publicly quoted market prices are used as fair value.
(ii) Long-term equity investments
The fair values of long-term equity investments are based on quoted market prices.
Management believes that it is not practicable to estimate the fair value of long-term
equity investments that do not have readily available market information.
(iii) Refundable deposits (recorded as other financial assets)
Refundable deposits are for the operating needs of consolidating entities. Since the
collecting periods were undeterminable, fair market value cannot be estimated.
Therefore, book values are used as fair market values.
(iv) Bonds payable
The fair values are based on quoted market prices.
(v) Long-term debt
The majority of the long-term debt is interest floating debt in which the carrying value
approximates the market value.
(vi) Retirement liabilities (recorded as other liabilities):
The fair values of retirement liabilities are based on the actuarial calculation, which used
December 31, 2004 and 2005, as the measurement dates.
5. Transactions with Related Parties
(a) The names and relationship of the related parties with which the Company had significant
transactions are shown below:
Name Relationship
BenQ Corporation (“BenQ”) Investee of the Company, accounted for
by equity method
Wistron Corporation (“Wistron”) Investee of the Company, accounted for
by equity method
e-LIFE MALL Corp. (“eLIFE”) Investee of the Company, accounted for
by equity method
Bluechip Infotech Pty Ltd. (“SAL”) Investee of the Company, accounted for
by equity method
Wistron InfoComm (Philippines) Corporation
(“WPH”)
Subsidiary of Wistron