Acer 2005 Annual Report Download - page 39
Download and view the complete annual report
Please find page 39 of the 2005 Acer annual report below. You can navigate through the pages in the report by either clicking on the pages listed below, or by using the keyword search tool below to find specific information within the annual report.-
 1
1 -
2
-
3
-
4
-
5
-
6
-
7
-
8
-
9
-
10
-
11
-
12
-
13
-
14
-
15
-
16
-
17
-
18
-
19
-
20
-
21
-
22
-
23
-
24
-
25
-
26
-
27
-
28
-
 29
29 -
 30
30 -
 31
31 -
 32
32 -
 33
33 -
 34
34 -
 35
35 -
 36
36 -
 37
37 -
 38
38 -
 39
39 -
 40
40 -
 41
41 -
 42
42 -
 43
43 -
 44
44 -
 45
45 -
 46
46 -
 47
47 -
 48
48 -
 49
49 -
50
-
51
-
52
-
53
-
54
-
55
-
56
-
57
-
58
-
59
-
60
-
61
-
62
-
63
-
64
-
65
-
66
-
67
-
68
-
69
-
70
-
71
-
72
-
73
-
74
-
75
-
76
-
77
-
78
-
79
-
80
-
81
-
82
-
83
-
84
-
85
-
86
-
87
-
88
-
89
 |
 |
- 34 -
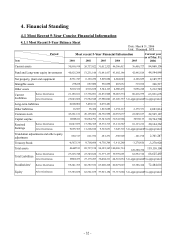
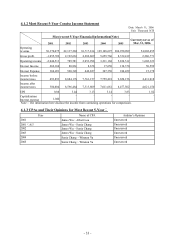
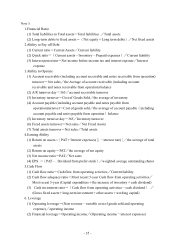
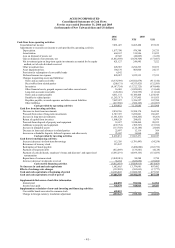
4.2 Most Recent 5-Year Financial Analysis
Most recent 5-Year Financial
Information
Period
Item 2001
NT$
2002
NT$
2003
NT$
2004
NT$
2005
NT$
Current
y
ear
as of Mar. 31,
2006
Total liabilities to total
assets 31.47 26.02 33.24 39.35 48.76 47.89
Financial
Ratio (%) Long-term debts to fixed
assets 764.91 1,200.35 1,230.87 1,328.66 1,654.09 1,796.04
Current ratio(%) 145.86 169.68 135.59 121.64 126.47 132.74
Quick Ratio(%) 123.56 155.14 128.37 113.97 113.79 124.08
Ability to
payoff debt
Interest protection 3 18 19 22 53 305
A/R turnover (times) 3.58 3.27 5.07 5.3 4.94 3.91
A/R turnover days 102 112 72 69 74 93
Inventory turnover (times) 14.83 20.73 49.43 55.19 37.62 32.07
Inventory turnover days 25 18 7 7 10 11
Fixed assets turnover (times) 7.96 7.99 14.07 27.68 49.88 52.37
Total assets turnover (times) 0.76 0.55 0.87 1.29 1.6 1.58
Ability to
operate
Return on assets(%) 1.59 10.26 8.31 7.5 7.55 12.07
Return on equity(%) 1.65 13.77 11.3 11.34 13.41 23.26
Operating
income -3.48 4.31 9.9 15.34 25.89 28.43
To pay-in
capital % PBT 3.16 44.37 37.43 37.07 42.8 81.81
N
et income ratio (%) 1.58 17.56 8.95 5.43 4.14 7.34
Earning ability
EPSNTD 0.08 3.44 3.13 3.14 3.83 1.82
Cash flow ratio 41.37 31.44 14.17 1.79 4.84 (2.74)
Cash flow adequacy ratio 83.01 86.98 80.9 69.62 80.78 43.22
Cash flow
(%)
Cash reinvestment ratio 10.06 4.16 - - Note: not
zero (2.28)
Operating leverage -1.39 1.84 0.76 0.63 0.45 0.59
Leverage Financial leverage 0.7 2.51 1.27 1.13 1.03 1.01