Acer 2005 Annual Report Download - page 44
Download and view the complete annual report
Please find page 44 of the 2005 Acer annual report below. You can navigate through the pages in the report by either clicking on the pages listed below, or by using the keyword search tool below to find specific information within the annual report.-
 1
1 -
2
-
3
-
4
-
5
-
6
-
7
-
8
-
9
-
10
-
11
-
12
-
13
-
14
-
15
-
16
-
17
-
18
-
19
-
20
-
21
-
22
-
23
-
24
-
25
-
26
-
27
-
28
-
29
-
30
-
31
-
32
-
33
-
 34
34 -
 35
35 -
 36
36 -
 37
37 -
 38
38 -
 39
39 -
 40
40 -
 41
41 -
 42
42 -
 43
43 -
 44
44 -
 45
45 -
 46
46 -
 47
47 -
 48
48 -
 49
49 -
 50
50 -
 51
51 -
 52
52 -
 53
53 -
 54
54 -
55
-
56
-
57
-
58
-
59
-
60
-
61
-
62
-
63
-
64
-
65
-
66
-
67
-
68
-
69
-
70
-
71
-
72
-
73
-
74
-
75
-
76
-
77
-
78
-
79
-
80
-
81
-
82
-
83
-
84
-
85
-
86
-
87
-
88
-
89
 |
 |

- 39 -
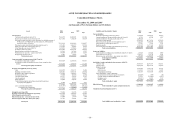
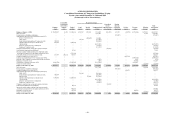
ACER INCORPORATED AND SUBSIDIARIES
Consolidated Statements of Income
For the years ended December 31, 2004 and 2005
(in thousands of New Taiwan dollars and US dollars, except per share data)
2004 2005
NT$ NT$ US$
Revenues (note 5) 225,014,007 318,087,679 9,687,458
Cost of revenues (note 5) (197,794,704) (283,966,218) (8,648,278)
Gross profit 27,219,303 34,121,461 1,039,180
Operating expenses (note 10)
Selling (20,579,110) (23,168,521) (705,604)
Administrative (2,389,309) (2,866,287) (87,294)
Research and development (444,227) (437,692) (13,330)
Total operating expenses (23,412,646) (26,472,500) (806,228)
Operating income 3,806,657 7,648,961 232,952
Non-operating income and gains:
Interest income 225,671 402,634 12,262
Investment gain recognized by equity method (note 4(6)) 147,402 - -
Gain on disposal of property and equipment - 46,605 1,419
Gain on disposal of investments, net (notes 4(2)(6)) 5,432,389 5,634,709 171,607
Other income 937,271 1,092,426 33,270
6,742,733 7,176,374 218,558
Non-operating expenses and loss:
Interest expense (596,007) (385,293) (11,734)
Investment loss recognized by equity method (note 4(6)) - (42,179) (1,285)
Other investment loss (notes 4(2)(6)) (628,587) (2,294,293) (69,873)
Loss on disposal of property and equipment (notes 4(2)(6)) (47,643) - -
Foreign currency exchange loss, net (339,135) (69,393) (2,113)
Asset impairment loss (notes 3 and 4(7)) - (805,000) (24,517)
Other loss (297,418) (576,645) (17,562)
(1,908,790) (4,172,803) (127,084)
Income before income taxes 8,640,600 10,652,532 324,426
Income tax expense (note 4(14)) (1,549,177) (2,187,044) (66,607)
Consolidated net income 7,091,423 8,465,488 257,819
Net income attributable to:
Shareholders of parent company 7,011,661 8,477,502 258,185
Minority shareholders 79,762 (12,014) (366)
7,091,423 8,465,488 257,819
Earnings per common share (note 4(16)):
Basic earnings per common share 3.14 3.83 0.12
Diluted earnings per common share 3.14 3.83 0.12