Abercrombie & Fitch 2015 Annual Report Download - page 63
Download and view the complete annual report
Please find page 63 of the 2015 Abercrombie & Fitch annual report below. You can navigate through the pages in the report by either clicking on the pages listed below, or by using the keyword search tool below to find specific information within the annual report.-
 1
1 -
2
-
3
-
4
-
5
-
6
-
7
-
8
-
9
-
10
-
11
-
12
-
13
-
14
-
15
-
16
-
17
-
18
-
19
-
20
-
21
-
22
-
23
-
24
-
25
-
26
-
27
-
28
-
29
-
30
-
31
-
32
-
33
-
34
-
35
-
36
-
37
-
38
-
39
-
40
-
41
-
42
-
43
-
44
-
45
-
46
-
47
-
48
-
49
-
50
-
51
-
52
-
 53
53 -
 54
54 -
 55
55 -
 56
56 -
 57
57 -
 58
58 -
 59
59 -
 60
60 -
 61
61 -
 62
62 -
 63
63 -
 64
64 -
 65
65 -
 66
66 -
 67
67 -
 68
68 -
 69
69 -
 70
70 -
 71
71 -
 72
72 -
 73
73 -
74
-
75
-
76
-
77
-
78
-
79
-
80
-
81
-
82
-
83
-
84
-
85
-
86
-
87
 |
 |

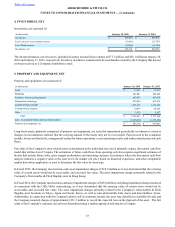
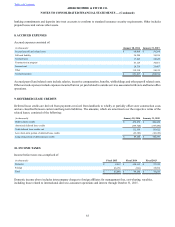
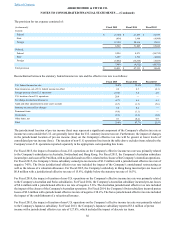
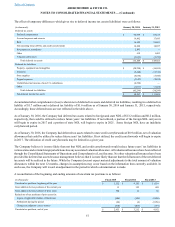
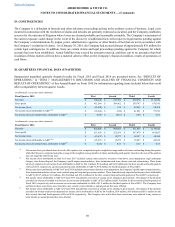
Table of Contents ABERCROMBIE & FITCH CO.
NOTES TO CONSOLIDATED FINANCIAL STATEMENTS — (Continued)
63
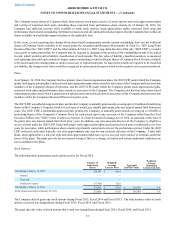
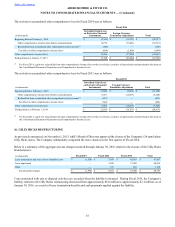
Restricted Stock Units
The following table summarizes activity for restricted stock units for Fiscal 2015:
Service-based Restricted
Stock Units Performance-based Restricted
Stock Units Market-based Restricted
Stock Units
Number of
Underlying
Shares
Weighted-
Average Grant
Date Fair Value
Number of
Underlying
Shares
Weighted-
Average Grant
Date Fair Value
Number of
Underlying
Shares
Weighted-
Average Grant
Date Fair Value
Unvested at January 31, 2015 1,566,272 $ 37.84 205,420 $ 32.06 36,374 $ 40.13
Granted 1,117,321 20.68 113,331 20.10 113,337 19.04
Adjustments for performance
achievement — — (28,250) 36.14 — —
Vested (637,837) 37.01 (48,668) 38.24 — —
Forfeited (374,159) 31.37 (56,333) 29.05 (32,000) 21.07
Unvested at January 30, 2016 1,671,597 $ 28.13 185,500 $ 23.42 117,711 $ 25.00
Fair value of both service-based and performance-based restricted stock units is calculated using the market price of the underlying
common stock on the date of grant reduced for anticipated dividend payments on unvested shares. In determining fair value, the
Company does not take into account performance-based vesting requirements. Performance-based vesting requirements are taken
into account in determining the number of awards expected to vest. For market-based restricted stock units, fair value is calculated
using a Monte Carlo simulation with the number of shares that ultimately vest dependent on the Company's total stockholder return
measured against the total stockholder return of a select group of peer companies over a three-year period. For an award with
performance-based or market-based vesting requirements, the number of shares that ultimately vest can vary from 0% to 200% of
target depending on the level of achievement of performance criteria. Unvested shares related to restricted stock units with
performance vesting conditions are reflected at 100% of their target vesting amount in the table above.
Service-based restricted stock units are expensed on a straight-line basis over the total requisite service period, net of forfeitures.
Performance-based restricted stock units subject to graded vesting are expensed on an accelerated attribution basis, net of forfeitures.
Market-based restricted stock units without graded vesting features are expensed on a straight-line basis over the requisite service
period, net of forfeitures.
As of January 30, 2016, there was $47.1 million, $3.1 million, and $1.6 million of total unrecognized compensation cost, net of
estimated forfeitures, related to service-based, performance-based and market-based restricted stock units, respectively. The
unrecognized compensation cost is expected to be recognized over a weighted-average period of 15 months, 13 months, and 12
months for service-based, performance-based and market-based restricted stock units, respectively.
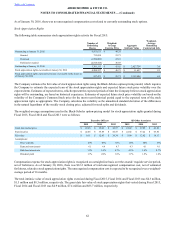
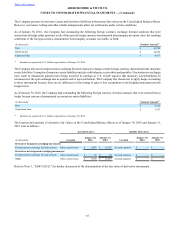
Additional information pertaining to restricted stock units for Fiscal 2015, Fiscal 2014 and Fiscal 2013 follows:
(in thousands) Fiscal 2015 Fiscal 2014 Fiscal 2013
Service-based restricted stock units:
Total grant date fair value of awards granted $ 23,101 $ 33,075 $ 23,192
Total grant date fair value of awards vested 23,608 17,078 14,535
Performance-based restricted stock units:
Total grant date fair value of awards granted $ 2,278 $ 4,709 $ 10,814
Total grant date fair value of awards vested 1,861 515 515
Market-based restricted stock units:
Total grant date fair value of awards granted $ 2,158 $ 3,756 $ —
Total grant date fair value of awards vested — — —