Abercrombie & Fitch 2015 Annual Report Download - page 42
Download and view the complete annual report
Please find page 42 of the 2015 Abercrombie & Fitch annual report below. You can navigate through the pages in the report by either clicking on the pages listed below, or by using the keyword search tool below to find specific information within the annual report.-
 1
1 -
2
-
3
-
4
-
5
-
6
-
7
-
8
-
9
-
10
-
11
-
12
-
13
-
14
-
15
-
16
-
17
-
18
-
19
-
20
-
21
-
22
-
23
-
24
-
25
-
26
-
27
-
28
-
29
-
30
-
31
-
 32
32 -
 33
33 -
 34
34 -
 35
35 -
 36
36 -
 37
37 -
 38
38 -
 39
39 -
 40
40 -
 41
41 -
 42
42 -
 43
43 -
 44
44 -
 45
45 -
 46
46 -
 47
47 -
 48
48 -
 49
49 -
 50
50 -
 51
51 -
 52
52 -
53
-
54
-
55
-
56
-
57
-
58
-
59
-
60
-
61
-
62
-
63
-
64
-
65
-
66
-
67
-
68
-
69
-
70
-
71
-
72
-
73
-
74
-
75
-
76
-
77
-
78
-
79
-
80
-
81
-
82
-
83
-
84
-
85
-
86
-
87
 |
 |

Table of Contents
42
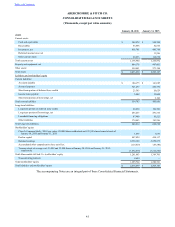
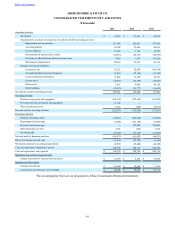
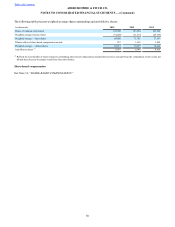
ABERCROMBIE & FITCH CO.
CONSOLIDATED STATEMENTS OF STOCKHOLDERS’ EQUITY
(Thousands, except per share amounts)
Common stock
Paid-in
capital
Non-
controlling
interest Retained
earnings
Accumulated
other
comprehensive
loss
Treasury stock
Total
stockholders’
equity
Shares
outstanding Par
value Shares At average
cost
Balance, February 2, 2013 78,445 $1,033 $403,271 $ — $2,567,261 $ (13,288) 24,855 $(1,140,009) $ 1,818,268
Net income 54,628 54,628
Purchase of common stock (2,383) 2,383 (115,806) (115,806)
Dividends ($0.80 per share) (61,923) (61,923)
Share-based compensation issuances
and exercises 340 (19,363) (3,696) (340) 15,302 (7,757)
Tax effect of share-based
compensation issuances and exercises (3,804) (3,804)
Share-based compensation expense 53,516 53,516
Net change in unrealized gains or
losses on derivative financial
instruments 5,054 5,054
Foreign currency translation
adjustments (12,683) (12,683)
Balance, February 1, 2014 76,402 $1,033 $433,620 $ — $2,556,270 $ (20,917) 26,898 $(1,240,513) $ 1,729,493
Net income 51,821 51,821
Purchase of common stock (7,324) 7,324 (285,038) (285,038)
Dividends ($0.80 per share) (57,362) (57,362)
Share-based compensation issuances
and exercises 274 (17,884) (56) (274) 12,989 (4,951)
Tax effect of share-based
compensation issuances and exercises (4,626) (4,626)
Share-based compensation expense 23,027 23,027
Net change in unrealized gains or
losses on derivative financial
instruments 15,266 15,266
Foreign currency translation
adjustments (77,929) (77,929)
Balance, January 31, 2015 69,352 $1,033 $434,137 $ — $2,550,673 $ (83,580) 33,948 $(1,512,562) $ 1,389,701
Net income 2,983 35,576 38,559
Purchase of common stock (2,461) 2,461 (50,033) (50,033)
Dividends ($0.80 per share) (55,145) (55,145)
Share-based compensation issuances
and exercises 457 (37,220) (908) (457) 30,019 (8,109)
Tax effect of share-based
compensation issuances and exercises (18,247) (18,247)
Share-based compensation expense 28,359 28,359
Net change in unrealized gains or
losses on derivative financial
instruments (8,523) (8,523)
Foreign currency translation
adjustments (22,516) (22,516)
Contributions from noncontrolling
interests, net 1,676 1,676
Balance, January 30, 2016 67,348 $1,033 $407,029 $ 4,659 $2,530,196 $ (114,619) 35,952 $(1,532,576) $ 1,295,722
The accompanying Notes are an integral part of these Consolidated Financial Statements.