Abercrombie & Fitch 2015 Annual Report Download - page 25
Download and view the complete annual report
Please find page 25 of the 2015 Abercrombie & Fitch annual report below. You can navigate through the pages in the report by either clicking on the pages listed below, or by using the keyword search tool below to find specific information within the annual report.-
 1
1 -
2
-
3
-
4
-
5
-
6
-
7
-
8
-
9
-
10
-
11
-
12
-
13
-
14
-
 15
15 -
 16
16 -
 17
17 -
 18
18 -
 19
19 -
 20
20 -
 21
21 -
 22
22 -
 23
23 -
 24
24 -
 25
25 -
 26
26 -
 27
27 -
 28
28 -
 29
29 -
 30
30 -
 31
31 -
 32
32 -
 33
33 -
 34
34 -
 35
35 -
36
-
37
-
38
-
39
-
40
-
41
-
42
-
43
-
44
-
45
-
46
-
47
-
48
-
49
-
50
-
51
-
52
-
53
-
54
-
55
-
56
-
57
-
58
-
59
-
60
-
61
-
62
-
63
-
64
-
65
-
66
-
67
-
68
-
69
-
70
-
71
-
72
-
73
-
74
-
75
-
76
-
77
-
78
-
79
-
80
-
81
-
82
-
83
-
84
-
85
-
86
-
87
 |
 |

Table of Contents
25
KEY BUSINESS INDICATORS
The following measurements are among the key business indicators reviewed by various members of management to gauge the
Company’s results:
• Comparable sales, defined as the aggregate of: (1) year-over-year sales for stores that have been open as the same brand
at least one year and whose square footage has not been expanded or reduced by more than 20% within the past year, with
prior year's net sales converted at the current year's foreign currency exchange rate to remove the impact of currency
fluctuation, and (2) year-over-year direct-to-consumer sales with prior year's net sales converted at the current year's foreign
currency exchange rate to remove the impact of currency fluctuation;
• Comparative results of operations with prior year's results converted at the current year's foreign currency exchange rate
to remove the impact of currency fluctuation;
• Gross profit and gross margin rate;
• Cost of sales, exclusive of depreciation and amortization, as a percentage of net sales;
• Selling margin, defined as sales price less original cost, by brand and product category;
• Stores and distribution expense as a percentage of net sales;
• Marketing, general and administrative expense as a percentage of net sales;
• Operating income and operating income as a percentage of net sales;
• Net income and net income attributable to A&F;
• Inventory per gross square foot and inventory to sales ratio;
• Cash flow and liquidity determined by the Company’s current ratio, working capital and free cash flow;
• Store metrics such as sales per gross square foot, average number of transactions per store and store contribution (defined
as store sales less direct costs of operating the store);
• Transactional metrics such as traffic and conversion, average unit retail price, average unit cost, average units per transaction
and average transaction values; and
• Return on invested capital and return on equity.
While not all of these metrics are disclosed publicly by the Company due to the proprietary nature of the information, the Company
publicly discloses and discusses many of these metrics within this Management’s Discussion and Analysis of Financial Condition
and Results of Operations.
RESULTS OF OPERATIONS
FISCAL 2015 COMPARED TO FISCAL 2014
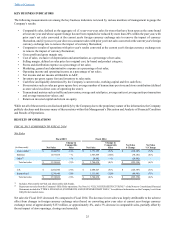
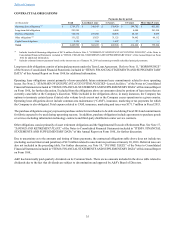
Net Sales
Fiscal 2015 Fiscal 2014
(in thousands) Net Sales
Change in
Comparable
Sales Net Sales
Change in
Comparable
Sales Net Sales
$ Change Net Sales
% Change
Abercrombie(1) $ 1,640,992 (6)% $ 1,771,299 (5)% $ (130,307) (7)%
Hollister 1,877,688 —% 1,947,869 (10)% (70,181) (4)%
Other(2) — —% 24,862 —% (24,862) -
Total net sales $ 3,518,680 (3)% $ 3,744,030 (8)% $ (225,350) (6)%
U.S. $ 2,282,040 (3)% $ 2,408,427 (6)% $ (126,387) (5)%
International 1,236,640 (1)% 1,335,603 (12)% (98,963) (7)%
Total net sales $ 3,518,680 (3)% $ 3,744,030 (8)% $ (225,350) (6)%
(1) Includes Abercrombie & Fitch and abercrombie kids brands.
(2) Represents net sales from the Company's Gilly Hicks operations. See Note 16, "GILLY HICKS RESTRUCTURING," of the Notes to Consolidated Financial
Statements included in "ITEM 8. FINANCIAL STATEMENTS AND SUPPLEMENTARY DATA," for additional information on the Company's exit from
Gilly Hicks branded stores.
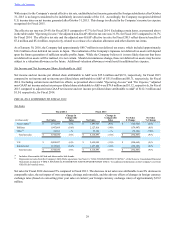
Net sales for Fiscal 2015 decreased 6% compared to Fiscal 2014. The decrease in net sales was largely attributable to the adverse
effect from changes in foreign currency exchange rates (based on converting prior year sales at current year foreign currency
exchange rates) of approximately $153 million, or approximately 4%, and a 3% decrease in comparable sales, partially offset by
the net impact of store openings, closings and remodels.