Abercrombie & Fitch 2015 Annual Report Download - page 31
Download and view the complete annual report
Please find page 31 of the 2015 Abercrombie & Fitch annual report below. You can navigate through the pages in the report by either clicking on the pages listed below, or by using the keyword search tool below to find specific information within the annual report.-
 1
1 -
2
-
3
-
4
-
5
-
6
-
7
-
8
-
9
-
10
-
11
-
12
-
13
-
14
-
15
-
16
-
17
-
18
-
19
-
20
-
 21
21 -
 22
22 -
 23
23 -
 24
24 -
 25
25 -
 26
26 -
 27
27 -
 28
28 -
 29
29 -
 30
30 -
 31
31 -
 32
32 -
 33
33 -
 34
34 -
 35
35 -
 36
36 -
 37
37 -
 38
38 -
 39
39 -
 40
40 -
 41
41 -
42
-
43
-
44
-
45
-
46
-
47
-
48
-
49
-
50
-
51
-
52
-
53
-
54
-
55
-
56
-
57
-
58
-
59
-
60
-
61
-
62
-
63
-
64
-
65
-
66
-
67
-
68
-
69
-
70
-
71
-
72
-
73
-
74
-
75
-
76
-
77
-
78
-
79
-
80
-
81
-
82
-
83
-
84
-
85
-
86
-
87
 |
 |
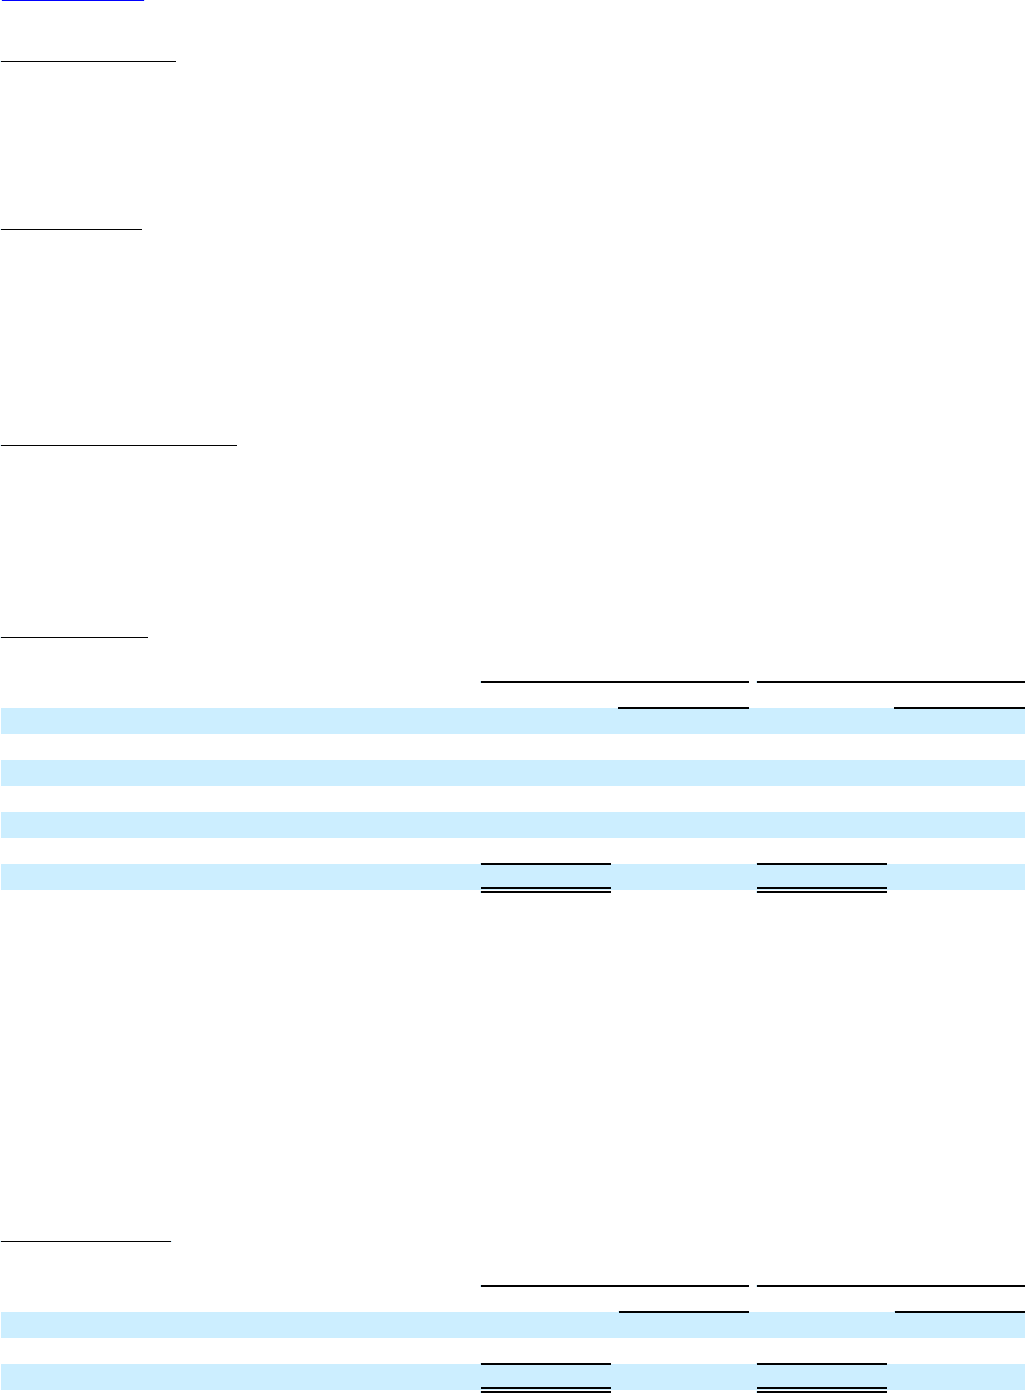
Table of Contents
31
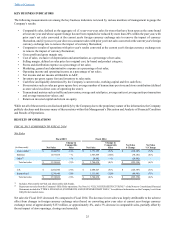
Restructuring Charge
Charges associated with the restructuring of the Gilly Hicks brand were $8.4 million for Fiscal 2014, of which $6.0 million related
to lease terminations and $2.1 million related to asset impairment. Charges associated with the restructuring of the Gilly Hicks
brand were $81.5 million for Fiscal 2013, of which $42.7 million related to lease terminations and $37.9 million related to asset
impairment.
Asset Impairment
The Company incurred non-cash asset impairment charges of $45.0 million for Fiscal 2014, compared to $46.7 million for Fiscal
2013 related primarily to stores whose asset carrying values were determined not to be recoverable and exceeded fair value. For
Fiscal 2014, store-related asset impairment charges are primarily related to the Company's Abercrombie & Fitch flagship store
locations in Tokyo, Japan and Seoul, Korea, as well as nine Hollister stores and nine abercrombie kids stores. Additionally, the
Company incurred charges of approximately $11.3 million for Fiscal 2014 to record the expected loss on disposal of the plan to
sell the Company-owned aircraft.
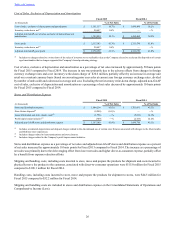
Other Operating Income, Net
Other operating income, net was $15.2 million for Fiscal 2014 compared to other operating income, net of $23.1 million for Fiscal
2013. Other operating income, net included income of $10.2 million related to insurance recoveries and $5.8 million related to
gift card breakage, partially offset by losses of $2.0 million related to foreign currency transactions for Fiscal 2014, compared to
income of $9.0 million related to insurance recoveries, $8.8 million related to gift card breakage and $2.9 million related to foreign
currency transactions for Fiscal 2013.
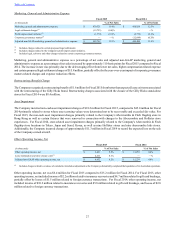
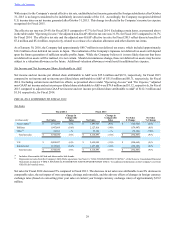
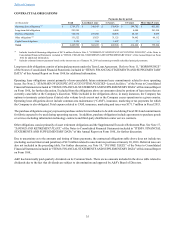
Operating Income
Fiscal 2014 Fiscal 2013
(in thousands) % of Net Sales % of Net Sales
Operating income $ 113,519 3.0% $ 80,823 2.0%
Asset impairment(1) 44,988 1.2% 46,715 1.1%
Corporate governance matters(2) 12,644 0.3% — —%
Restructuring charges(3) 8,431 0.2% 81,500 2.0%
Profit improvement initiative(4) 6,499 0.2% 13,839 0.3%
Lease termination and store closure costs(5) 5,612 0.1% — —%
Adjusted non-GAAP operating income $ 191,693 5.1% $ 222,877 5.4%
(1) Includes impairment charges related to stores whose asset carrying values were determined not to be recoverable and exceeded fair value, and for Fiscal
2014, a fair value adjustment to the Company-owned aircraft.
(2) Includes legal, advisory and other charges related to certain corporate governance matters.
(3) Includes restructuring charges associated with the closure of the Gilly Hicks stand-alone stores.
(4) Includes charges related to the Company's profit improvement initiative.
(5) Includes charges related to lease terminations and store closures.
Operating income as a percentage of net sales increased by approximately 110 basis points for Fiscal 2014 compared to Fiscal
2013. The year-over-year change in rate was primarily due to the the net year-over-year impact of certain items, as presented
above, and expense reduction related to the Company's profit improvement initiative, partially offset by the deleveraging effect
of negative comparable sales and investment in direct-to-consumer operations. Excluding certain items, as presented above,
adjusted non-GAAP income as a percentage of net sales decreased approximately 30 basis points for Fiscal 2014 compared to
Fiscal 2013.
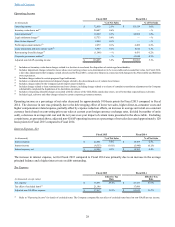
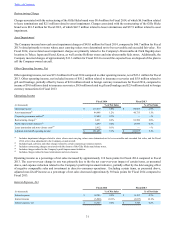
Interest Expense, Net
Fiscal 2014 Fiscal 2013
(in thousands) % of Net Sales % of Net Sales
Interest expense $ 18,305 0.5% $ 11,183 0.3%
Interest income (3,940) (0.1)% (3,637) (0.1)%
Interest expense, net $ 14,365 0.4% $ 7,546 0.2%