Abercrombie & Fitch 2015 Annual Report Download - page 36
Download and view the complete annual report
Please find page 36 of the 2015 Abercrombie & Fitch annual report below. You can navigate through the pages in the report by either clicking on the pages listed below, or by using the keyword search tool below to find specific information within the annual report.-
 1
1 -
2
-
3
-
4
-
5
-
6
-
7
-
8
-
9
-
10
-
11
-
12
-
13
-
14
-
15
-
16
-
17
-
18
-
19
-
20
-
21
-
22
-
23
-
24
-
25
-
 26
26 -
 27
27 -
 28
28 -
 29
29 -
 30
30 -
 31
31 -
 32
32 -
 33
33 -
 34
34 -
 35
35 -
 36
36 -
 37
37 -
 38
38 -
 39
39 -
 40
40 -
 41
41 -
 42
42 -
 43
43 -
 44
44 -
 45
45 -
 46
46 -
47
-
48
-
49
-
50
-
51
-
52
-
53
-
54
-
55
-
56
-
57
-
58
-
59
-
60
-
61
-
62
-
63
-
64
-
65
-
66
-
67
-
68
-
69
-
70
-
71
-
72
-
73
-
74
-
75
-
76
-
77
-
78
-
79
-
80
-
81
-
82
-
83
-
84
-
85
-
86
-
87
 |
 |

Table of Contents
36
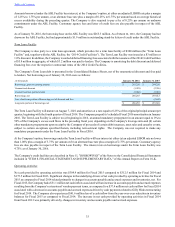
STORE ACTIVITY
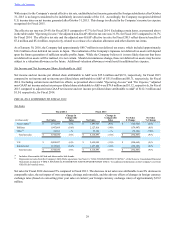
During the year, the Company opened fifteen international full-price stores, including its first Abercrombie & Fitch store in the
United Arab Emirates (UAE), 6 U.S. full-price stores and 9 U.S. outlet stores. In addition, the Company closed 55 U.S. stores and
four international stores.
Store count and gross square footage by brand and geography are presented below:
Abercrombie (1) Hollister (2) Total
United States International United States International United States International
February 1, 2014 381 24 458 129 839 153
New 6 8 2 7 8 15
Closed (26) — (27) (1) (53) (1)
January 31, 2015 361 32 433 135 794 167
New 13 7 2 8 15 15
Closed (34) — (21) (4) (55) (4)
January 30, 2016 340 39 414 139 754 178
Gross square feet (in thousands):
January 31, 2015 2,798 560 2,988 1,171 5,786 1,731
January 30, 2016 2,634 619 2,856 1,183 5,490 1,802
(1) Abercrombie includes the Company's Abercrombie & Fitch and abercrombie kids brands. Prior period store counts have been restated to combine Abercrombie
& Fitch stores with abercrombie kids carveouts into one store. The change reduced total stores by eight stores as of January 31, 2015 and by six stores as of
February 1, 2014. Excludes one international franchise store as of January 30, 2016.
(2) Includes seven international Gilly Hicks store closures and one U.S Gilly Hicks store closure during Fiscal 2014. Excludes two international franchise stores
as of January 30, 2016.
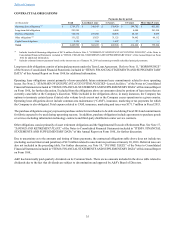
CAPITAL EXPENDITURES
Capital expenditures totaled $143.2 million, $174.6 million and $163.9 million for Fiscal 2015, Fiscal 2014 and Fiscal 2013,
respectively. A summary of capital expenditures is as follows:
(in thousands) Fiscal 2015 Fiscal 2014 Fiscal 2013
New store construction, store refreshes and remodels $ 71,675 $ 86,316 $ 101,404
Home office, distribution centers and information technology 71,524 88,291 62,521
Total capital expenditures $ 143,199 $ 174,607 $ 163,925
The Company expects capital expenditures in the range of $150 million to $175 million for Fiscal 2016, which will be prioritized
toward new stores and store updates, as well as direct-to-consumer and information technology investments to support growth
initiatives.
RECENT ACCOUNTING PRONOUNCEMENTS
See Note 2, "SUMMARY OF SIGNIFICANT ACCOUTING POLICIES - Recent accounting pronouncements" of the Notes to the
Consolidated Financial Statements included in "ITEM 8. FINANCIAL STATEMENT AND SUPPLEMENTARY DATA," of this
Annual Report on Form 10-K for recent accounting pronouncements, including the expected dates of adoption and anticipated
effects on our Consolidated Financial Statements.
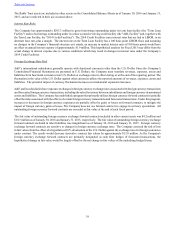
CRITICAL ACCOUNTING POLICIES AND ESTIMATES
The Company’s discussion and analysis of its financial condition and results of operations are based upon the Company’s
consolidated financial statements which have been prepared in accordance with accounting principles generally accepted in the
United States of America. The preparation of these consolidated financial statements requires the Company to make estimates and
assumptions that affect the reported amounts of assets, liabilities, revenues and expenses. Since actual results may differ from
those estimates, the Company revises its estimates and assumptions as new information becomes available.