Abercrombie & Fitch 2015 Annual Report Download - page 28
Download and view the complete annual report
Please find page 28 of the 2015 Abercrombie & Fitch annual report below. You can navigate through the pages in the report by either clicking on the pages listed below, or by using the keyword search tool below to find specific information within the annual report.-
 1
1 -
2
-
3
-
4
-
5
-
6
-
7
-
8
-
9
-
10
-
11
-
12
-
13
-
14
-
15
-
16
-
17
-
 18
18 -
 19
19 -
 20
20 -
 21
21 -
 22
22 -
 23
23 -
 24
24 -
 25
25 -
 26
26 -
 27
27 -
 28
28 -
 29
29 -
 30
30 -
 31
31 -
 32
32 -
 33
33 -
 34
34 -
 35
35 -
 36
36 -
 37
37 -
 38
38 -
39
-
40
-
41
-
42
-
43
-
44
-
45
-
46
-
47
-
48
-
49
-
50
-
51
-
52
-
53
-
54
-
55
-
56
-
57
-
58
-
59
-
60
-
61
-
62
-
63
-
64
-
65
-
66
-
67
-
68
-
69
-
70
-
71
-
72
-
73
-
74
-
75
-
76
-
77
-
78
-
79
-
80
-
81
-
82
-
83
-
84
-
85
-
86
-
87
 |
 |

Table of Contents
28
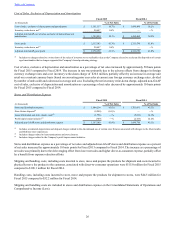
Operating Income
Fiscal 2015 Fiscal 2014
(in thousands) % of Net Sales % of Net Sales
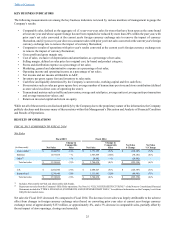
Operating income $ 72,838 2.1% $ 113,519 3.0%
Inventory write-down, net(1) 20,647 0.6% — —%
Asset impairment(2) 18,209 0.5% 44,988 1.2%
Legal settlement charges(3) 15,753 0.4% — —%
Store fixture disposal(4) 4,200 0.1% — —%
Profit improvement initiative(5) 2,479 0.1% 6,499 0.2%
Lease termination and store closure costs(6) 3,967 0.1% 5,612 0.1%
Restructuring (benefit) charges(7) (1,598) —% 8,431 0.2%
Corporate governance matters(8) — —% 12,644 0.3%
Adjusted non-GAAP operating income $ 136,495 3.9% $ 191,693 5.1%
(1) Includes net inventory write-down charges related to a decision to accelerate the disposition of certain aged merchandise.
(2) Includes impairment charges related to stores whose asset carrying values were determined not to be recoverable and exceeded fair value, for Fiscal 2014,
a fair value adjustment to the Company-owned aircraft, and for Fiscal 2015, certain store fixtures in connection with changes to the Abercrombie and Hollister
store experiences.
(3) Includes charges related to certain proposed legal settlements.
(4) Includes accelerated depreciation and disposal charges related to the discontinued use of certain store fixtures.
(5) Includes charges related to the Company's profit improvement initiative.
(6) Includes charges related to lease terminations and store closures, including charges related to a release of cumulative translation adjustment as the Company
substantially completed the liquidation of its Australian operations.
(7) Includes restructuring (benefit) charges associated with the closure of the Gilly Hicks stand-alone stores, net of better than expected lease exit terms.
(8) Includes legal, advisory and other charges related to certain corporate governance matters.
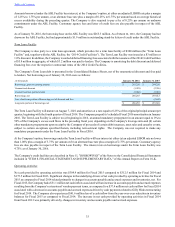
Operating income as a percentage of net sales decreased by approximately 100 basis points for Fiscal 2015 compared to Fiscal
2014. The decrease in rate was primarily due to the deleveraging effect of lower net sales, higher direct-to-consumer costs and
higher compensation related expense, partially offset by expense reduction efforts, an increase in average unit retail on a constant
currency basis (based on converting prior year sales at current year foreign currency exchange rates, divided by number of units
sold), a decrease in average unit cost and the net year-over-year impact of certain items presented in the above table. Excluding
certain items, as presented above, adjusted non-GAAP operating income as a percentage of net sales decreased approximately 120
basis points for Fiscal 2015 compared to Fiscal 2014.
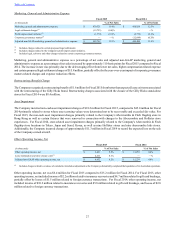
Interest Expense, Net
Fiscal 2015 Fiscal 2014
(in thousands) % of Net Sales % of Net Sales
Interest expense $ 22,601 0.6% $ 18,305 0.5%
Interest income (4,353) (0.1)% (3,940) (0.1)%
Interest expense, net $ 18,248 0.5% $ 14,365 0.4%
The increase in interest expense, net for Fiscal 2015 compared to Fiscal 2014 was primarily due to an increase in the average
principal balance and a higher interest rate on debt outstanding.
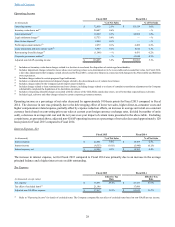
Tax Expense
Fiscal 2015 Fiscal 2014
(in thousands, except ratios) Effective Tax
Rate Effective Tax
Rate
Tax expense $ 16,031 29.4% $ 47,333 47.7%
Tax effect of excluded items(1) 21,186 17,686
Adjusted non-GAAP tax expense $ 37,217 31.5% $ 65,019 36.7%
(1) Refer to "Operating Income" for details of excluded items. The Company computed the tax effect of excluded items based on non-GAAP pre-tax income.