Abercrombie & Fitch 2015 Annual Report Download - page 30
Download and view the complete annual report
Please find page 30 of the 2015 Abercrombie & Fitch annual report below. You can navigate through the pages in the report by either clicking on the pages listed below, or by using the keyword search tool below to find specific information within the annual report.-
 1
1 -
2
-
3
-
4
-
5
-
6
-
7
-
8
-
9
-
10
-
11
-
12
-
13
-
14
-
15
-
16
-
17
-
18
-
19
-
 20
20 -
 21
21 -
 22
22 -
 23
23 -
 24
24 -
 25
25 -
 26
26 -
 27
27 -
 28
28 -
 29
29 -
 30
30 -
 31
31 -
 32
32 -
 33
33 -
 34
34 -
 35
35 -
 36
36 -
 37
37 -
 38
38 -
 39
39 -
 40
40 -
41
-
42
-
43
-
44
-
45
-
46
-
47
-
48
-
49
-
50
-
51
-
52
-
53
-
54
-
55
-
56
-
57
-
58
-
59
-
60
-
61
-
62
-
63
-
64
-
65
-
66
-
67
-
68
-
69
-
70
-
71
-
72
-
73
-
74
-
75
-
76
-
77
-
78
-
79
-
80
-
81
-
82
-
83
-
84
-
85
-
86
-
87
 |
 |

Table of Contents
30
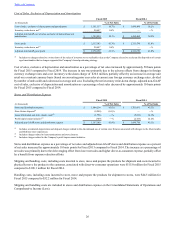
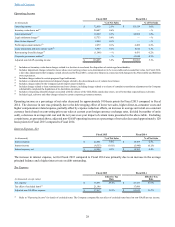
Cost of Sales, Exclusive of Depreciation and Amortization
Fiscal 2014 Fiscal 2013
(in thousands) % of Net Sales % of Net Sales
Net sales $ 3,744,030 100.0% $ 4,116,897 100.0%
Cost of sales, exclusive of depreciation and amortization 1,430,460 38.2% 1,541,462 37.4%
Gross profit $ 2,313,570 61.8% $ 2,575,435 62.6%
Cost of sales, exclusive of depreciation and amortization as a percentage of net sales increased by approximately 80 basis points
for Fiscal 2014 compared to Fiscal 2013. The increase in rate was primarily due to increased promotional activity, including
shipping promotions in the direct-to-consumer business, partially offset by lower average unit cost.
Stores and Distribution Expense
Fiscal 2014 Fiscal 2013
(in thousands) % of Net Sales % of Net Sales
Stores and distribution expense $ 1,703,051 45.5% $ 1,907,687 46.3%
Lease termination and store closure costs(1) (5,612) (0.1)% — —%
Profit improvement initiative(2) (2,723) (0.1)% (1,131) —%
Adjusted non-GAAP stores and distribution expense $ 1,694,716 45.3% $ 1,906,556 46.3%
(1) Includes charges related to lease terminations and store closures.
(2) Includes charges related to the Company's profit improvement initiative.
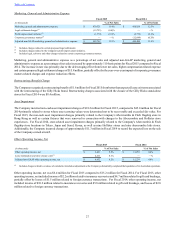
Stores and distribution expense as a percentage of net sales decreased by approximately 90 basis points for Fiscal 2014 compared
to Fiscal 2013. The decrease in rate was primarily due to savings from the profit improvement initiative primarily related to in-
store payroll and other controllable stores expenses, partially offset by the deleveraging effect of negative comparable sales and
higher direct-to-consumer expense. Excluding certain items, as presented in the above table, adjusted non-GAAP stores and
distribution expense as a percent of net sales decreased by approximately 100 basis points for Fiscal 2014 compared to Fiscal
2013.
Shipping and handling costs, including costs incurred to store, move and prepare the products for shipment and costs incurred to
physically move the product to the customer, associated with direct-to-consumer operations were $108.1 million for Fiscal 2014
compared to $93.4 million for Fiscal 2013.
Handling costs, including costs incurred to store, move and prepare the products for shipment to stores, were $52.2 million for
Fiscal 2014 compared to $53.9 million for Fiscal 2013.
Shipping and handling costs are included in stores and distribution expense on the Consolidated Statements of Operations and
Comprehensive Income (Loss).
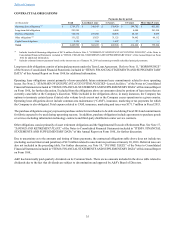
Marketing, General and Administrative Expense
Fiscal 2014 Fiscal 2013
(in thousands) % of Net Sales % of Net Sales
Marketing, general and administrative expense $ 458,820 12.3% $ 481,784 11.7%
Profit improvement initiative(1) (3,776) (0.1)% (12,708) (0.3)%
Corporate governance matters(2) (12,644) (0.3)% — —%
Adjusted non-GAAP marketing, general and administrative expense $ 442,400 11.8% $ 469,076 11.4%
(1) Includes charges related to the Company's profit improvement initiative.
(2) Includes legal, advisory and other charges related to certain corporate governance matters.
Marketing, general and administrative expense as a percentage of net sales increased by approximately 60 basis points for Fiscal
2014 compared to Fiscal 2013. The increase in rate was driven primarily by the deleveraging effect of negative comparable sales
and an increase in marketing expense, partially offset by a decrease in compensation expense. Excluding certain items, presented
in the above table, adjusted non-GAAP marketing, general and administrative expense increased as a percent of net sales by
approximately 40 basis points for Fiscal 2014 compared to Fiscal 2013.