Abercrombie & Fitch 2015 Annual Report Download - page 26
Download and view the complete annual report
Please find page 26 of the 2015 Abercrombie & Fitch annual report below. You can navigate through the pages in the report by either clicking on the pages listed below, or by using the keyword search tool below to find specific information within the annual report.-
 1
1 -
2
-
3
-
4
-
5
-
6
-
7
-
8
-
9
-
10
-
11
-
12
-
13
-
14
-
15
-
 16
16 -
 17
17 -
 18
18 -
 19
19 -
 20
20 -
 21
21 -
 22
22 -
 23
23 -
 24
24 -
 25
25 -
 26
26 -
 27
27 -
 28
28 -
 29
29 -
 30
30 -
 31
31 -
 32
32 -
 33
33 -
 34
34 -
 35
35 -
 36
36 -
37
-
38
-
39
-
40
-
41
-
42
-
43
-
44
-
45
-
46
-
47
-
48
-
49
-
50
-
51
-
52
-
53
-
54
-
55
-
56
-
57
-
58
-
59
-
60
-
61
-
62
-
63
-
64
-
65
-
66
-
67
-
68
-
69
-
70
-
71
-
72
-
73
-
74
-
75
-
76
-
77
-
78
-
79
-
80
-
81
-
82
-
83
-
84
-
85
-
86
-
87
 |
 |

Table of Contents
26
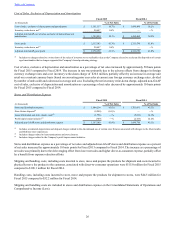
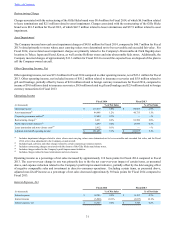
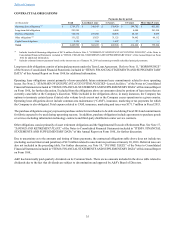
Cost of Sales, Exclusive of Depreciation and Amortization
Fiscal 2015 Fiscal 2014
(in thousands) % of Net Sales % of Net Sales
Cost of sales, exclusive of depreciation and amortization $ 1,361,137 38.7% $ 1,430,460 38.2%
Inventory write-down, net(1) 20,647 0.6% — —%
Adjusted non-GAAP cost of sales, exclusive of depreciation and
amortization $ 1,340,490 38.1% $ 1,430,460 38.2%
Gross profit $ 2,157,543 61.3% $ 2,313,570 61.8%
Inventory write-down, net(1) 20,647 0.6% — —%
Adjusted non-GAAP gross profit $ 2,178,190 61.9% $ 2,313,570 61.8%
(1) Includes net charges related to a write-down of the value of inventory to net realizable value as the Company elected to accelerate the disposition of certain
aged merchandise that no longer supported the Company's brand positioning strategy.
Cost of sales, exclusive of depreciation and amortization as a percentage of net sales increased by approximately 50 basis points
for Fiscal 2015 compared to Fiscal 2014. The increase in rate was primarily due to the adverse effects from changes in foreign
currency exchange rates and a net inventory write-down charge of $20.6 million, partially offset by an increase in average unit
retail on a constant currency basis (based on converting prior year sales at current year foreign currency exchange rates, divided
by number of units sold) and a decrease in average unit cost. Excluding the net inventory write-down charge, adjusted non-GAAP
cost of sales, exclusive of depreciation and amortization as a percentage of net sales decreased by approximately 10 basis points
for Fiscal 2015 compared to Fiscal 2014.
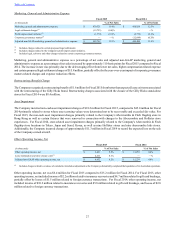
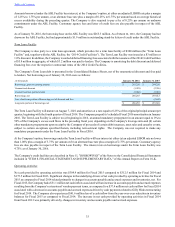
Stores and Distribution Expense
Fiscal 2015 Fiscal 2014
(in thousands) % of Net Sales % of Net Sales
Stores and distribution expense $ 1,604,214 45.6% $ 1,703,051 45.5%
Store fixture disposal(1) (4,200) (0.1)% — —%
Lease termination and store closure costs(2) (1,756) —% (5,612) (0.1)%
Profit improvement initiative(3) (709) —% (2,723) (0.1)%
Adjusted non-GAAP stores and distribution expense $ 1,597,549 45.4% $ 1,694,716 45.3%
(1) Includes accelerated depreciation and disposal charges related to the discontinued use of certain store fixtures associated with changes to the Abercrombie
and Hollister store experiences.
(2) Includes charges related to lease terminations and store closures.
(3) Includes charges related to the Company's profit improvement initiative.
Stores and distribution expense as a percentage of net sales and adjusted non-GAAP stores and distribution expense as a percent
of net sales increased by approximately 10 basis points for Fiscal 2015 compared to Fiscal 2014. The increase as a percentage of
net sales was primarily due to the deleveraging effect from lower net sales and higher direct-to-consumer expense, partially offset
by a benefit from expense reduction efforts.
Shipping and handling costs, including costs incurred to store, move and prepare the products for shipment and costs incurred to
physically move the product to the customer, associated with direct-to-consumer operations were $115.0 million for Fiscal 2015
compared to $108.1 million for Fiscal 2014.
Handling costs, including costs incurred to store, move and prepare the products for shipment to stores, were $44.5 million for
Fiscal 2015 compared to $52.2 million for Fiscal 2014.
Shipping and handling costs are included in stores and distribution expense on the Consolidated Statements of Operations and
Comprehensive Income (Loss).