Abercrombie & Fitch 2015 Annual Report Download - page 50
Download and view the complete annual report
Please find page 50 of the 2015 Abercrombie & Fitch annual report below. You can navigate through the pages in the report by either clicking on the pages listed below, or by using the keyword search tool below to find specific information within the annual report.-
 1
1 -
2
-
3
-
4
-
5
-
6
-
7
-
8
-
9
-
10
-
11
-
12
-
13
-
14
-
15
-
16
-
17
-
18
-
19
-
20
-
21
-
22
-
23
-
24
-
25
-
26
-
27
-
28
-
29
-
30
-
31
-
32
-
33
-
34
-
35
-
36
-
37
-
38
-
39
-
 40
40 -
 41
41 -
 42
42 -
 43
43 -
 44
44 -
 45
45 -
 46
46 -
 47
47 -
 48
48 -
 49
49 -
 50
50 -
 51
51 -
 52
52 -
 53
53 -
 54
54 -
 55
55 -
 56
56 -
 57
57 -
 58
58 -
 59
59 -
 60
60 -
61
-
62
-
63
-
64
-
65
-
66
-
67
-
68
-
69
-
70
-
71
-
72
-
73
-
74
-
75
-
76
-
77
-
78
-
79
-
80
-
81
-
82
-
83
-
84
-
85
-
86
-
87
 |
 |
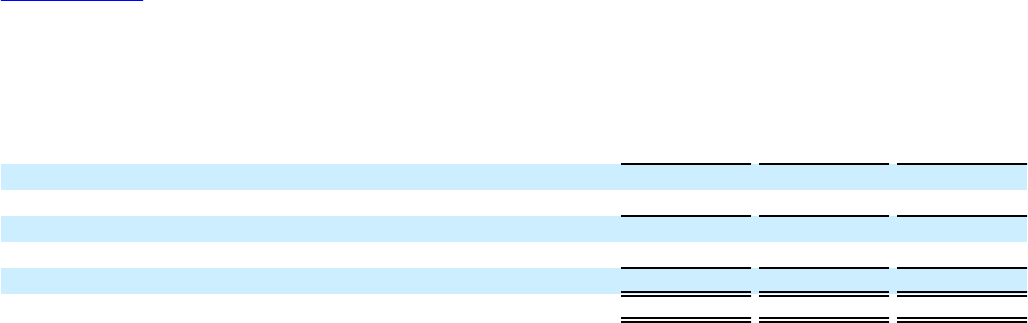
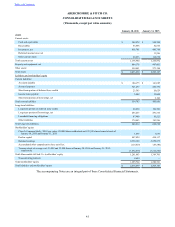
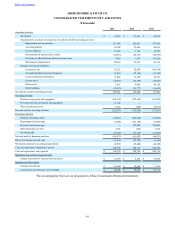
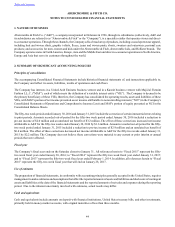
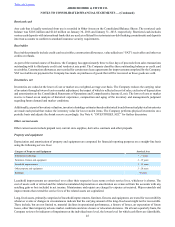
Table of Contents ABERCROMBIE & FITCH CO.
NOTES TO CONSOLIDATED FINANCIAL STATEMENTS — (Continued)
50
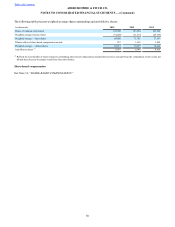
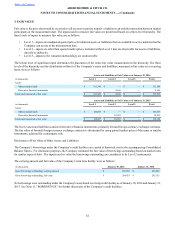
The following table presents weighted-average shares outstanding and anti-dilutive shares:
(in thousands) 2015 2014 2013
Shares of common stock issued 103,300 103,300 103,300
Weighted-average treasury shares (34,420) (31,515) (26,143)
Weighted-average — basic shares 68,880 71,785 77,157
Dilutive effect of share-based compensation awards 537 1,152 1,509
Weighted-average — diluted shares 69,417 72,937 78,666
Anti-dilutive shares (1) 8,967 6,144 4,630
(1) Reflects the total number of shares related to outstanding share-based compensation awards that have been excluded from the computation of net income per
diluted share because the impact would have been anti-dilutive.
Share-based compensation
See Note 13, “SHARE-BASED COMPENSATION.”