Abercrombie & Fitch 2015 Annual Report Download - page 43
Download and view the complete annual report
Please find page 43 of the 2015 Abercrombie & Fitch annual report below. You can navigate through the pages in the report by either clicking on the pages listed below, or by using the keyword search tool below to find specific information within the annual report.-
 1
1 -
2
-
3
-
4
-
5
-
6
-
7
-
8
-
9
-
10
-
11
-
12
-
13
-
14
-
15
-
16
-
17
-
18
-
19
-
20
-
21
-
22
-
23
-
24
-
25
-
26
-
27
-
28
-
29
-
30
-
31
-
32
-
 33
33 -
 34
34 -
 35
35 -
 36
36 -
 37
37 -
 38
38 -
 39
39 -
 40
40 -
 41
41 -
 42
42 -
 43
43 -
 44
44 -
 45
45 -
 46
46 -
 47
47 -
 48
48 -
 49
49 -
 50
50 -
 51
51 -
 52
52 -
 53
53 -
54
-
55
-
56
-
57
-
58
-
59
-
60
-
61
-
62
-
63
-
64
-
65
-
66
-
67
-
68
-
69
-
70
-
71
-
72
-
73
-
74
-
75
-
76
-
77
-
78
-
79
-
80
-
81
-
82
-
83
-
84
-
85
-
86
-
87
 |
 |

Table of Contents
43
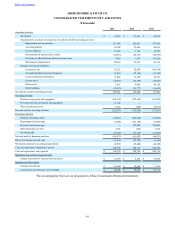
ABERCROMBIE & FITCH CO.
CONSOLIDATED STATEMENTS OF CASH FLOWS
(Thousands)
2015 2014 2013
Operating activities
Net income $ 38,559 $ 51,821 $ 54,628
Adjustments to reconcile net income to net cash provided by operating activities
Depreciation and amortization 213,680 226,421 235,240
Asset impairment 18,209 47,084 84,655
Loss on disposal 11,082 5,794 16,909
Amortization of deferred lease credits (28,619) (38,437) (45,895)
Provision for (Benefit from) deferred income taxes 7,469 1,676 (41,263)
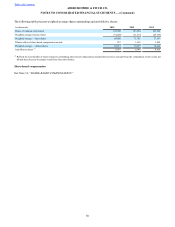
Share-based compensation 28,359 23,027 53,516
Changes in assets and liabilities
Inventories, net 21,253 62,854 (103,304)
Accounts payable and accrued expenses 51,050 (37,394) (73,749)
Lessor construction allowances 11,082 13,182 20,523
Income taxes (45,027) (34,659) (55,456)
Other assets 7,967 6,888 44,138
Other liabilities (25,123) (15,777) (14,449)
Net cash provided by operating activities 309,941 312,480 175,493
Investing activities
Purchases of property and equipment (143,199) (174,624) (163,924)
Proceeds from sale of property and equipment 11,109 — —
Other investing activities 9,523 (450) (9,937)
Net cash used for investing activities (122,567) (175,074) (173,861)
Financing activities
Purchase of treasury stock (50,033) (285,038) (115,806)
Repayments of borrowings (6,000) (195,750) (15,000)
Proceeds from borrowings — 357,000 150,000
Other financing activities 4,303 (303) 1,898
Dividends paid (55,145) (57,362) (61,923)
Net cash used for financing activities (106,875) (181,453) (40,831)
Effect of exchange rates on cash (12,629) (35,361) (4,190)
Net increase (decrease) in cash and equivalents 67,870 (79,408) (43,389)
Cash and equivalents, beginning of period 520,708 600,116 643,505
Cash and equivalents, end of period $ 588,578 $ 520,708 $ 600,116
Significant non-cash investing activities
Change in accrual for construction in progress $ 12,859 $ 6,525 $ 10,820
Supplemental information
Cash paid for interest $ 16,060 $ 18,609 $ 4,565
Cash paid for income taxes, net of refunds $ 48,702 $ 74,685 $ 116,312
The accompanying Notes are an integral part of these Consolidated Financial Statements.