Abercrombie & Fitch 2015 Annual Report Download - page 23
Download and view the complete annual report
Please find page 23 of the 2015 Abercrombie & Fitch annual report below. You can navigate through the pages in the report by either clicking on the pages listed below, or by using the keyword search tool below to find specific information within the annual report.-
 1
1 -
2
-
3
-
4
-
5
-
6
-
7
-
8
-
9
-
10
-
11
-
12
-
 13
13 -
 14
14 -
 15
15 -
 16
16 -
 17
17 -
 18
18 -
 19
19 -
 20
20 -
 21
21 -
 22
22 -
 23
23 -
 24
24 -
 25
25 -
 26
26 -
 27
27 -
 28
28 -
 29
29 -
 30
30 -
 31
31 -
 32
32 -
 33
33 -
34
-
35
-
36
-
37
-
38
-
39
-
40
-
41
-
42
-
43
-
44
-
45
-
46
-
47
-
48
-
49
-
50
-
51
-
52
-
53
-
54
-
55
-
56
-
57
-
58
-
59
-
60
-
61
-
62
-
63
-
64
-
65
-
66
-
67
-
68
-
69
-
70
-
71
-
72
-
73
-
74
-
75
-
76
-
77
-
78
-
79
-
80
-
81
-
82
-
83
-
84
-
85
-
86
-
87
 |
 |

Table of Contents
23
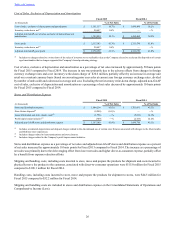
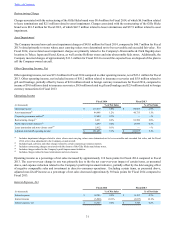
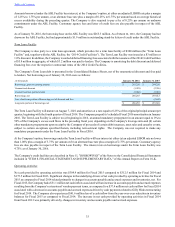
The tables below reconcile certain GAAP financial measures to non-GAAP financial measures for Fiscal 2015 and Fiscal 2014.
Fiscal 2015
(in thousands, except gross profit rate and per share amounts) GAAP Excluded Items(1) Non-GAAP
Gross profit rate 61.3% 0.6% 61.9%
Operating income $ 72,838 $ 63,657 $ 136,495
Net income attributable to A&F $ 35,576 $ 42,471 $ 78,047
Net income per diluted share attributable to A&F $ 0.51 $ 0.61 $ 1.12
Fiscal 2014
(in thousands, except gross profit rate and per share amounts) GAAP Excluded Items(1) Non-GAAP
Gross profit rate 61.8% —% 61.8%
Operating income $ 113,519 $ 78,174 $ 191,693
Net income attributable to A&F $ 51,821 $ 60,488 $ 112,309
Net income per diluted share attributable to A&F $ 0.71 $ 0.83 $ 1.54
(1) Refer to "RESULTS OF OPERATIONS" for details on excluded items.