ADT 2014 Annual Report Download - page 38
Download and view the complete annual report
Please find page 38 of the 2014 ADT annual report below. You can navigate through the pages in the report by either clicking on the pages listed below, or by using the keyword search tool below to find specific information within the annual report.-
 1
1 -
2
-
3
-
4
-
5
-
6
-
7
-
8
-
9
-
10
-
11
-
12
-
13
-
14
-
15
-
16
-
17
-
18
-
19
-
20
-
21
-
22
-
23
-
24
-
25
-
26
-
27
-
 28
28 -
 29
29 -
 30
30 -
 31
31 -
 32
32 -
 33
33 -
 34
34 -
 35
35 -
 36
36 -
 37
37 -
 38
38 -
 39
39 -
 40
40 -
 41
41 -
 42
42 -
 43
43 -
 44
44 -
 45
45 -
 46
46 -
 47
47 -
 48
48 -
49
-
50
-
51
-
52
-
53
-
54
-
55
-
56
-
57
-
58
-
59
-
60
-
61
-
62
-
63
-
64
-
65
-
66
-
67
-
68
-
69
-
70
-
71
-
72
-
73
-
74
-
75
-
76
-
77
-
78
-
79
-
80
-
81
-
82
-
83
-
84
-
85
-
86
-
87
-
88
-
89
-
90
-
91
-
92
-
93
-
94
-
95
-
96
-
97
-
98
-
99
-
100
-
101
-
102
-
103
-
104
-
105
-
106
-
107
-
108
-
109
-
110
-
111
-
112
-
113
-
114
-
115
-
116
-
117
-
118
-
119
-
120
-
121
-
122
-
123
-
124
-
125
-
126
-
127
-
128
-
129
-
130
-
131
-
132
-
133
-
134
-
135
-
136
-
137
-
138
-
139
-
140
-
141
-
142
-
143
-
144
-
145
-
146
-
147
-
148
-
149
-
150
-
151
-
152
-
153
-
154
-
155
-
156
-
157
-
158
-
159
-
160
-
161
-
162
-
163
-
164
-
165
-
166
-
167
-
168
-
169
-
170
-
171
-
172
 |
 |

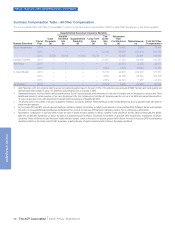
COMPENSATION OF EXECUTIVE OFFICERS—CONTINUED
Description of Performance Measures:“Recurring Revenue
Growth” is defined as the growth in revenue generated by monthly
recurring fees related to electronic security, interactive home and
business automation and related monitoring services. Revenues
associated with the installation of our security and automation
systems, along with other one-time revenues, are excluded from this
calculation. From time to time, discretionary adjustments may be
applied for AIP and Officer Bonus Plan purposes. “Steady State Free
Cash Flow” is defined as a measure of pre-levered cash generated
by the Company after the cost of replacing recurring revenue lost to
attrition, but before the cost of new subscribers that drive recurring
revenue growth. Steady State Free Cash Flow is calculated by
subtracting both the Subscriber Acquisition Cost (“SAC”) required to
maintain recurring revenue and maintenance capex from EBITDA
(pre-SAC). From time to time, discretionary adjustments may be
applied for AIP and Officer Bonus Plan purposes. “Net Attrition” is the
customer revenue attrition rate which is defined as recurring revenue
lost resulting from customer attrition, net of dealer charge-backs and
re-sales. The customer revenue attrition rate is a 52-week trailing
ratio, the numerator of which is the recurring revenue lost during the
period due to attrition, net of dealer charge-backs and re-sales, and
the denominator of which is total annualized recurring revenue based
on an average of recurring revenue under contract at the beginning of
each month during the period.
In approving payouts for each of our NEOs in November 2014, the
Compensation Committee (and, in the case of the CEO, the
independent members of the Board of Directors) first determined the
amount of the maximum bonus award each NEO was eligible to
receive under the Officer Bonus Plan, based upon the Company’s
Operating Income performance. The Compensation Committee then
determined the final awards for each of the NEOs through the
exercise of negative discretion based upon both the achievement of
the quantitative performance measures shown in the Fiscal 2014
Annual Incentive Compensation Design Summary table above and a
Strategic Modifier.
The Strategic Modifier provides the Compensation Committee the
ability to adjust the awards as calculated based upon the quantitative
performance measures plus or minus twenty percent (+/- 20%). The
Compensation Committee evaluated the overall strategic
performance of the Company, which included Small Business
Recurring Revenue Growth and Recurring Revenue Margin as well as
other strategic factors and, based upon that overall assessment,
made the determination that the overall pool of funds available to
allocate for awards for the Executive Officers of the Company,
including the NEOs, would be reduced by five (5) percentage points.
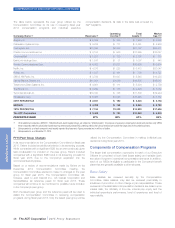
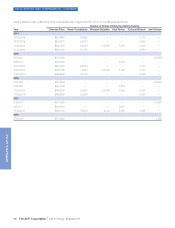
The table below shows the maximum and target annual incentive
compensation opportunities, as well as the actual incentive payouts
earned for fiscal year 2014, for each of our NEOs. These incentive
payments earned are reported in the “Non-Equity Incentive Plan
Compensation” column of the Summary Compensation Table on
page 35 of this Proxy Statement.
Named Executive Officer Maximum Target Actual
Naren Gursahaney $1,800,000 $900,000 $630,000
Michael Geltzeiler $1,500,000 $750,000 $538,125
Alan Ferber $ 700,000 $350,000 $235,200
N. David Bleisch $ 595,000 $297,500 $211,374
Jerri DeVard (1) $ 700,000 $350,000 $126,594
(1) Maximum and target amounts for Ms. DeVard represent annual amounts. Actual amount was pro-rated for the period from Ms. DeVard’s hire date (March 31, 2014) through the end of the
fiscal year.
Long-Term Incentive Program
The Company’s LTIP is designed to provide a significant portion of
executives’ compensation opportunity in equity-based instruments. In
so doing, the LTIP is a key component in aligning the long-term
interests of executives with those of stockholders, thus promoting
value creation for both our executives and stockholders. A majority of
total equity granted under the LTIP is awarded during our annual grant
process. This process occurs in conjunction with our annual
assessment of individual performance and potential, and also takes
into account a review of the competitive compensation landscape.
Awards of equity under the annual LTIP process are delivered to
employees utilizing a mix of Stock Options, RSUs and PSUs. The
weighting of the different components of the awards varies by
employee level. In fiscal year 2014 we increased the weighting of
PSUs while reducing the weighting of Stock Options. The value of
awards granted to our CEO and the other NEOs during the annual
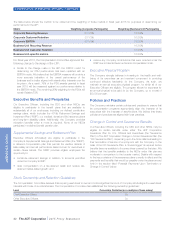
LTIP process are based upon the following mix of equity:
Grant Type Weighting
PSUs 50%
Stock Options 25%
RSUs 25%
30 The ADT Corporation 2015 Proxy Statement
PROXY STATEMENT