ADT 2014 Annual Report Download - page 111
Download and view the complete annual report
Please find page 111 of the 2014 ADT annual report below. You can navigate through the pages in the report by either clicking on the pages listed below, or by using the keyword search tool below to find specific information within the annual report.-
 1
1 -
2
-
3
-
4
-
5
-
6
-
7
-
8
-
9
-
10
-
11
-
12
-
13
-
14
-
15
-
16
-
17
-
18
-
19
-
20
-
21
-
22
-
23
-
24
-
25
-
26
-
27
-
28
-
29
-
30
-
31
-
32
-
33
-
34
-
35
-
36
-
37
-
38
-
39
-
40
-
41
-
42
-
43
-
44
-
45
-
46
-
47
-
48
-
49
-
50
-
51
-
52
-
53
-
54
-
55
-
56
-
57
-
58
-
59
-
60
-
61
-
62
-
63
-
64
-
65
-
66
-
67
-
68
-
69
-
70
-
71
-
72
-
73
-
74
-
75
-
76
-
77
-
78
-
79
-
80
-
81
-
82
-
83
-
84
-
85
-
86
-
87
-
88
-
89
-
90
-
91
-
92
-
93
-
94
-
95
-
96
-
97
-
98
-
99
-
100
-
 101
101 -
 102
102 -
 103
103 -
 104
104 -
 105
105 -
 106
106 -
 107
107 -
 108
108 -
 109
109 -
 110
110 -
 111
111 -
 112
112 -
 113
113 -
 114
114 -
 115
115 -
 116
116 -
 117
117 -
 118
118 -
 119
119 -
 120
120 -
 121
121 -
122
-
123
-
124
-
125
-
126
-
127
-
128
-
129
-
130
-
131
-
132
-
133
-
134
-
135
-
136
-
137
-
138
-
139
-
140
-
141
-
142
-
143
-
144
-
145
-
146
-
147
-
148
-
149
-
150
-
151
-
152
-
153
-
154
-
155
-
156
-
157
-
158
-
159
-
160
-
161
-
162
-
163
-
164
-
165
-
166
-
167
-
168
-
169
-
170
-
171
-
172
 |
 |

FORM 10-K
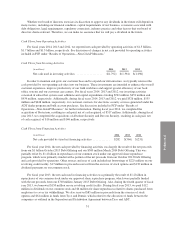
Interest Expense, net
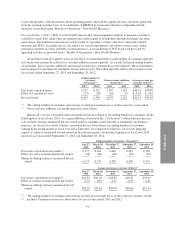
Interest expense, net is comprised primarily of interest on our long-term debt. Net interest expense was $192
million for fiscal year 2014 compared with $117 million for fiscal year 2013. Interest expense for fiscal year
2014 reflects an increase in borrowings related to the issuances of $1 billion in notes during October 2013 and
$500 million in notes during March 2014.
Other (Expense) Income
Other expense was $35 million for fiscal year 2014 compared with other income of $24 million for fiscal
year 2013. Other expense for fiscal year 2014 was primarily the result of a $38 million reduction in amounts
owed to ADT by Tyco pursuant to the 2012 Tax Sharing Agreement largely due to the resolution of certain
unrecognized tax benefits. Other income for fiscal year 2013 was primarily the result of $23 million in non-
taxable income recorded pursuant to the 2012 Tax Sharing Agreement for amounts owed by Tyco and Pentair in
connection with the exercise of ADT share based awards held by certain Tyco and Pentair employees. See Note 6
to the Consolidated and Combined Financial Statements for more information.
Income Tax Expense
Income tax expense was $128 million for fiscal year 2014 compared with $221 million for fiscal year 2013,
and the effective tax rate fell to 29.6% from 34.4%. The effective tax rate for fiscal year 2014 reflects the net
impact of a $42 million favorable adjustment resulting from the resolution of certain unrecognized tax benefits
partially offset by the unfavorable deferred tax impact of $17 million from IRS audit adjustments. The effective
tax rate for fiscal year 2014 also reflects the unfavorable impact resulting from $38 million in non-taxable other
expense discussed in “Other (Expense) Income” above.
The effective tax rate can vary from period to period due to permanent tax adjustments, discrete items such
as the settlement of income tax audits and changes in tax laws, as well as recurring factors such as changes in the
overall effective state tax rate. See Note 6 to the Consolidated and Combined Financial Statements for more
information on income taxes.
Year Ended September 27, 2013 Compared with Year Ended September 28, 2012
Revenue
Revenue increased by $81 million, or 2.5%, to $3.3 billion for fiscal year 2013 as compared with fiscal year
2012, primarily due to the growth in recurring customer revenue, which increased by $138 million, or 4.8%. This
increase was primarily the result of higher average revenue per customer as well as growth in customer accounts,
net of attrition. The growth in recurring customer revenue was partially offset by a decrease in other revenue,
which went down by $57 million, or 17.5%, to $268 million for fiscal year 2013 as compared with fiscal year
2012. The reduction in other revenue was due to the mix shift toward more ADT-owned systems rather than
outright system sales, resulting in higher deferred revenue and lower current period installation revenue.
Average revenue per customer increased by $1.36, or 3.4%, as of September 27, 2013 compared with
September 28, 2012 primarily due to price escalations on our existing customer base and the addition of new
customers at higher rates, including increased ADT Pulse®customers compared to total customer additions.
Gross customer additions were approximately 1.1 million during fiscal year 2013, reflecting customer
account growth of 644,000 in the direct channel and 453,000 in the dealer channel. Additionally, we acquired
approximately 117,000 customer accounts in conjunction with our acquisition of Devcon Security, which was
completed in August 2013. Excluding these accounts, gross customer additions fell by 55,000, or 4.8%, during
fiscal year 2013 as compared to fiscal year 2012, as increases in additions from our direct channel were not
sufficient to offset lower dealer channel production.
45