ADT 2014 Annual Report Download - page 36
Download and view the complete annual report
Please find page 36 of the 2014 ADT annual report below. You can navigate through the pages in the report by either clicking on the pages listed below, or by using the keyword search tool below to find specific information within the annual report.-
 1
1 -
2
-
3
-
4
-
5
-
6
-
7
-
8
-
9
-
10
-
11
-
12
-
13
-
14
-
15
-
16
-
17
-
18
-
19
-
20
-
21
-
22
-
23
-
24
-
25
-
 26
26 -
 27
27 -
 28
28 -
 29
29 -
 30
30 -
 31
31 -
 32
32 -
 33
33 -
 34
34 -
 35
35 -
 36
36 -
 37
37 -
 38
38 -
 39
39 -
 40
40 -
 41
41 -
 42
42 -
 43
43 -
 44
44 -
 45
45 -
 46
46 -
47
-
48
-
49
-
50
-
51
-
52
-
53
-
54
-
55
-
56
-
57
-
58
-
59
-
60
-
61
-
62
-
63
-
64
-
65
-
66
-
67
-
68
-
69
-
70
-
71
-
72
-
73
-
74
-
75
-
76
-
77
-
78
-
79
-
80
-
81
-
82
-
83
-
84
-
85
-
86
-
87
-
88
-
89
-
90
-
91
-
92
-
93
-
94
-
95
-
96
-
97
-
98
-
99
-
100
-
101
-
102
-
103
-
104
-
105
-
106
-
107
-
108
-
109
-
110
-
111
-
112
-
113
-
114
-
115
-
116
-
117
-
118
-
119
-
120
-
121
-
122
-
123
-
124
-
125
-
126
-
127
-
128
-
129
-
130
-
131
-
132
-
133
-
134
-
135
-
136
-
137
-
138
-
139
-
140
-
141
-
142
-
143
-
144
-
145
-
146
-
147
-
148
-
149
-
150
-
151
-
152
-
153
-
154
-
155
-
156
-
157
-
158
-
159
-
160
-
161
-
162
-
163
-
164
-
165
-
166
-
167
-
168
-
169
-
170
-
171
-
172
 |
 |

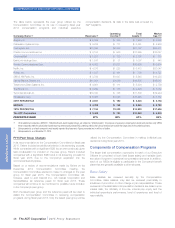
COMPENSATION OF EXECUTIVE OFFICERS—CONTINUED
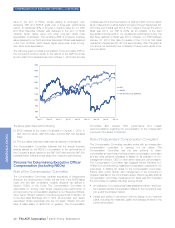
The table below represents the peer group utilized by the
Compensation Committee for its use in reviewing fiscal year
2014 compensation programs and individual executive
compensation decisions. All data in the table was provided by
S&P Capital IQ.
Company Name (1) Revenues (2)
Operating
Income (2)
Total
Assets (2)
Market
Cap (2)(3)
Allegion plc $ 2,094 $ 385 $ 1,980 $ 5,028
Cablevision Systems Corp. $ 6,232 $ 771 $ 6,591 $ 4,950
CenturyLink, Inc. $18,095 $2,833 $51,787 $22,811
Charter Communications, Inc. $ 8,155 $ 956 $17,295 $16,027
Cincinnati Bell $ 1,257 $ 189 $ 2,107 $ 718
EarthLink Holdings Corp. $ 1,241 $ 31 $ 1,007 $ 448
Frontier Communications Corp. $ 4,762 $1,031 $16,635 $ 6,514
Netflix, Inc. $ 4,375 $ 228 $ 5,413 $23,047
Rollins, Inc. $ 1,337 $ 191 $ 739 $ 4,727
SIRIUS XM Radio, Inc. $ 3,799 $1,047 $ 8,845 $19,258
Stanley Black & Decker, Inc. $11,001 $1,089 $16,535 $15,012
Telephone & Data Systems, Inc. $ 4,901 -$ 111 $ 8,904 $ 2,789
The Brink’s Co. $ 3,942 $ 183 $ 2,498 $ 1,039
Tyco International Ltd. $10,340 $ 745 $11,809 $19,244
Windstream Corp. $ 5,988 $1,048 $13,445 $ 5,732
25TH PERCENTILE $ 2,947 $ 190 $ 2,303 $ 3,758
MEDIAN $ 4,762 $ 745 $ 8,845 $ 5,732
75TH PERCENTILE $ 7,194 $1,039 $14,990 $17,636
The ADT Corporation $ 3,408 $ 720 $10,549 $ 6,203
PERCENTILE RANK 27% 50% 61% 54%
(1) Three additional companies, DIRECTV, T-Mobile US and Ascent Capital Group, are utilized as “reference peers” for purposes of assessing compensation design and practices only. While
these companies meet the subscription-based recurring revenue and primary B2C screening criteria, their annual revenues are outside the range used in the screening process.
(2) Data presented is as of each company’s most recently reported fiscal year end. Figures presented are in millions of dollars.
(3) Data presented is as of November 11, 2014.
FY15 Peer Group Changes
In its recommendation to the Compensation Committee for fiscal year
2015, Farient included an additional criterion in its screening process.
While companies with a significant B2B focus were previously given
less consideration for inclusion in the peer group, Farient included
companies with a significant B2B focus in its screening process for
fiscal year 2015 due to the Company’s expansion into the
commercial security space.
Based on a review of recommendations made by Farient at the
December 2014 Compensation Committee meeting, the
Compensation Committee elected to make no changes to the peer
group for fiscal year 2015. The Compensation Committee did,
however, elect to add Diebold Inc., US Cellular Corporation and
ServiceMaster as reference peers for fiscal year 2015. These
companies will continue to be monitored for possible future inclusion
in the Company’s peer group.
Both the select peer group and the reference peers will be used to
assist the Compensation Committee in reviewing compensation
programs during fiscal year 2015. Only the select peer group will be
utilized by the Compensation Committee in making individual pay
decisions during fiscal year 2015.
Components of Compensation Programs
The target total compensation opportunity for each of our Executive
Officers is comprised of both fixed (base salary) and variable (both
annual and long-term incentives) compensation elements. In addition,
each of our NEOs is eligible to participate in the Company’s benefit
plans that are generally available to all employees.
Base Salary
Base salaries are reviewed annually by the Compensation
Committee. Base salaries may also be reviewed periodically in
situations of promotion or other change in job responsibilities. These
reviews and the associated compensation decisions are based upon
market data, the criticality of the role, internal pay equity and the
individual executive’s performance, level of experience and level of
responsibility.
28 The ADT Corporation 2015 Proxy Statement
PROXY STATEMENT