ADT 2014 Annual Report Download - page 33
Download and view the complete annual report
Please find page 33 of the 2014 ADT annual report below. You can navigate through the pages in the report by either clicking on the pages listed below, or by using the keyword search tool below to find specific information within the annual report.-
 1
1 -
2
-
3
-
4
-
5
-
6
-
7
-
8
-
9
-
10
-
11
-
12
-
13
-
14
-
15
-
16
-
17
-
18
-
19
-
20
-
21
-
22
-
 23
23 -
 24
24 -
 25
25 -
 26
26 -
 27
27 -
 28
28 -
 29
29 -
 30
30 -
 31
31 -
 32
32 -
 33
33 -
 34
34 -
 35
35 -
 36
36 -
 37
37 -
 38
38 -
 39
39 -
 40
40 -
 41
41 -
 42
42 -
 43
43 -
44
-
45
-
46
-
47
-
48
-
49
-
50
-
51
-
52
-
53
-
54
-
55
-
56
-
57
-
58
-
59
-
60
-
61
-
62
-
63
-
64
-
65
-
66
-
67
-
68
-
69
-
70
-
71
-
72
-
73
-
74
-
75
-
76
-
77
-
78
-
79
-
80
-
81
-
82
-
83
-
84
-
85
-
86
-
87
-
88
-
89
-
90
-
91
-
92
-
93
-
94
-
95
-
96
-
97
-
98
-
99
-
100
-
101
-
102
-
103
-
104
-
105
-
106
-
107
-
108
-
109
-
110
-
111
-
112
-
113
-
114
-
115
-
116
-
117
-
118
-
119
-
120
-
121
-
122
-
123
-
124
-
125
-
126
-
127
-
128
-
129
-
130
-
131
-
132
-
133
-
134
-
135
-
136
-
137
-
138
-
139
-
140
-
141
-
142
-
143
-
144
-
145
-
146
-
147
-
148
-
149
-
150
-
151
-
152
-
153
-
154
-
155
-
156
-
157
-
158
-
159
-
160
-
161
-
162
-
163
-
164
-
165
-
166
-
167
-
168
-
169
-
170
-
171
-
172
 |
 |

COMPENSATION OF EXECUTIVE OFFICERS—CONTINUED
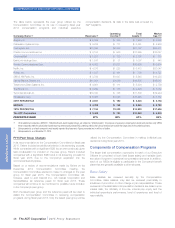
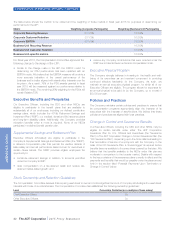
The chart below shows the distribution of targeted total direct pay for
our CEO and the other NEOs (on average) for fiscal year 2014. This
chart illustrates that 84% of CEO target annual compensation and, on
average, 74% of target annual compensation for our other NEOs, is at
risk based on Company and individual performance:
CEO Other NEOs
Base Salary Annual Incentive Long-Term Incentives Base Salary Annual Incentive Long-Term Incentives
53%
21%
26%
68%
16%
16%
Note that the percentages shown in the chart above reflect target
compensation, and are not reflective of actual compensation values
presented in the Summary Compensation Table on page 35 of this
Proxy Statement.
NEO compensation is reviewed annually by the Compensation
Committee (and, in the case of the CEO, by the independent
members of the Board of Directors) to ensure alignment with the
Company’s compensation objectives and market practice.
Fiscal Year 2014 Compensation Decisions
In fiscal year 2014, we made some changes to our incentive
compensation programs which were designed to further align our
incentive plans with the interests of our stockholders, including:
•Replaced the Adjusted Free Cash Flow metrics in our Officer
Short-Term Bonus Plan (“Officer Bonus Plan”), Annual Incentive
Plan (“AIP”) and Long-Term Incentive Plan (“LTIP”) with Steady
State Free Cash Flow (“SSFCF”) metrics. We believed that SSFCF
more accurately captures the impact of the key value drivers of
our business, and moves closer to an ongoing earnings measure.
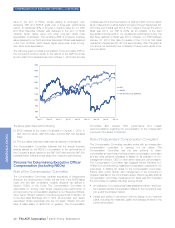
•Modified the metrics utilized in the Performance Share Unit (“PSU”)
component of our LTIP. The PSUs granted in fiscal year 2014 will
vest based upon our performance against Relative Total
Shareholder Return (“TSR”) and SSFCF metrics, which were
weighted equally at 50%. We believed that replacing the Recurring
Revenue metric previously in use in the LTIP with the TSR metric
more appropriately captures the overall performance of the
Company in comparison to the broader market, as reflected in
stock price movement and adjusted for dividends. For purposes
of the TSR metric, our stock performance is compared to the
median performance of companies in the Standard & Poor’s
(“S&P”) 500 Index.
•Adjusted the weighting of the equity mix for our Executive Officers
to increase the weighting of PSUs and reduce the weighting of
Stock Options. The equity mix for Executive Officers for awards
granted in conjunction with the annual grant process was as
follows: 50% PSUs, 25% Stock Options and 25% Restricted
Stock Units (“RSUs”). The decision to increase the weighting of
PSUs was made to further align the interests of our Executive
Officers with those of our stockholders.
Pay for Performance
We strongly believe that a significant portion of our executives’
compensation opportunity should be correlated with our
performance. Annual incentive compensation and 50% of long-term
equity incentive compensation (in the form of PSUs) is earned only
when the NEOs attain specified goals (including, for our NEOs other
than the CEO, certain individual objectives included as part of our
annual incentive program), thereby placing a substantial portion of
executive compensation at risk. The remaining 50% of our executives’
long-term equity incentive compensation is awarded in Stock Options
and time-vested RSUs, the value of each of which is dependent on
our performance over an extended vesting period as exhibited in the
performance of our stock price. We believe the design of our
incentive compensation plans creates additional incentive for our
executives to focus on sustainable, long-term growth.
Short-Term Incentives. The Compensation Committee set aggressive
targets in our annual incentive plans for fiscal year 2014 to focus our
executives on taking appropriate actions to ensure the Company is
well-positioned for long-term success. In fiscal year 2014, the
Company did not fully meet the aggressive targets set in our AIP (see
the performance targets and actual performance in “Fiscal Year 2014
Annual Incentive Compensation Design Summary”, as well as the
discussion regarding our fiscal year 2014 performance, below). As a
result, our CEO was awarded an annual incentive equal to 70% of his
targeted annual payout. Our other NEOs received an average payout
of 70.5% of their targeted awards, including the impact of their
performance against individual objectives. The Compensation
Committee believes these results reflect the proper alignment of pay
and performance. The Compensation Committee continued to set
aggressive targets for fiscal year 2015 to ensure the relationship with
performance continues.
Long-Term Incentives. The fiscal year 2014 long-term incentive
program was designed to reward management for performance
directly related to increasing stockholder value. Our CEO and the
other Executive Officers received 50% of their long-term incentive
The ADT Corporation 2015 Proxy Statement 25
PROXY STATEMENT