ADT 2014 Annual Report Download - page 107
Download and view the complete annual report
Please find page 107 of the 2014 ADT annual report below. You can navigate through the pages in the report by either clicking on the pages listed below, or by using the keyword search tool below to find specific information within the annual report.-
 1
1 -
2
-
3
-
4
-
5
-
6
-
7
-
8
-
9
-
10
-
11
-
12
-
13
-
14
-
15
-
16
-
17
-
18
-
19
-
20
-
21
-
22
-
23
-
24
-
25
-
26
-
27
-
28
-
29
-
30
-
31
-
32
-
33
-
34
-
35
-
36
-
37
-
38
-
39
-
40
-
41
-
42
-
43
-
44
-
45
-
46
-
47
-
48
-
49
-
50
-
51
-
52
-
53
-
54
-
55
-
56
-
57
-
58
-
59
-
60
-
61
-
62
-
63
-
64
-
65
-
66
-
67
-
68
-
69
-
70
-
71
-
72
-
73
-
74
-
75
-
76
-
77
-
78
-
79
-
80
-
81
-
82
-
83
-
84
-
85
-
86
-
87
-
88
-
89
-
90
-
91
-
92
-
93
-
94
-
95
-
96
-
 97
97 -
 98
98 -
 99
99 -
 100
100 -
 101
101 -
 102
102 -
 103
103 -
 104
104 -
 105
105 -
 106
106 -
 107
107 -
 108
108 -
 109
109 -
 110
110 -
 111
111 -
 112
112 -
 113
113 -
 114
114 -
 115
115 -
 116
116 -
 117
117 -
118
-
119
-
120
-
121
-
122
-
123
-
124
-
125
-
126
-
127
-
128
-
129
-
130
-
131
-
132
-
133
-
134
-
135
-
136
-
137
-
138
-
139
-
140
-
141
-
142
-
143
-
144
-
145
-
146
-
147
-
148
-
149
-
150
-
151
-
152
-
153
-
154
-
155
-
156
-
157
-
158
-
159
-
160
-
161
-
162
-
163
-
164
-
165
-
166
-
167
-
168
-
169
-
170
-
171
-
172
 |
 |

FORM 10-K
to provide investors with information about operating profits, adjusted for significant non-cash items, generated
from the existing customer base. A reconciliation of EBITDA to net income (the most comparable GAAP
measure) is provided under “Results of Operations—Non-GAAP Measures.”
Free Cash Flow (“FCF”). FCF is a non-GAAP measure that our management employs to measure cash that is
available to repay debt, make other investments and return capital to stockholders through dividends and share
repurchases. The difference between net cash provided by operating activities (the most comparable GAAP
measure) and FCF is the deduction of cash outlays for capital expenditures, subscriber system assets, dealer
generated customer accounts and bulk account purchases. A reconciliation of FCF to net cash provided by
operating activities is provided under “Results of Operations—Non-GAAP Measures.”
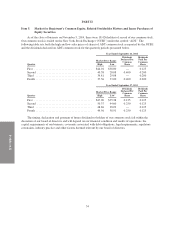
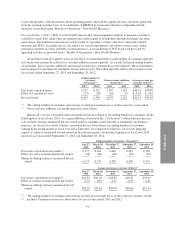
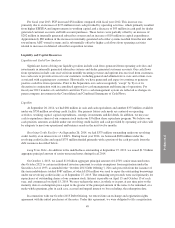
As reported in the first quarter of fiscal year 2014, we determined that a small number of customer upgrades
in Canada were incorrectly reflected as customer additions in prior periods. As a result, historical ending number
of customers, gross customer additions and average revenue per customer have been adjusted. These adjustments
had no impact on our financial statements for any prior periods. The following table reflects the revisions for the
fiscal years ended September 27, 2013 and September 28, 2012:
Ending number of
customers
(thousands)(1)
Gross customer additions
(thousands)(2)
Average revenue per
customer (dollars)(1)
2013 2012 2013 2012 2013 2012
Previously reported metric ................ 6,521 6,422 1,107 1,161 $40.31 $38.87
Effect of Canadian revision ................ (27) (26) (10) (9) $ 0.16 $ 0.16
Revised metric .......................... 6,494 6,396 1,097 1,152 $40.47 $39.03
(1) The ending number of customers and average revenue per customer are as of the respective years ended.
(2) Gross customer additions are for the respective years ended.
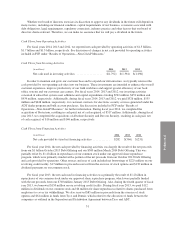
Historically, we have included contracts monitored but not owned in our ending number of customers. In the
fourth quarter of fiscal year 2014, we acquired Reliance Protectron Inc. (“Protectron”), whose business practice
is to exclude contracts monitored but not owned from its customer count. In order to harmonize our business
practices, we elected to exclude contracts monitored but not owned from our ending number of customers
starting in the fourth quarter of fiscal year 2014. Therefore, for comparative purposes, we are providing the
impact of contracts monitored but not owned on the relevant metrics for historical quarters of fiscal year 2014
and for fiscal years ended September 27, 2013 and September 28, 2012:
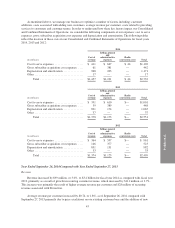
Ending number of customers (thousands)(1)
June 27,
2014
March 28,
2014
December 27,
2013
September 27,
2013
September 28,
2012
Previously reported/revised metric(2) .......... 6,377 6,416 6,448 6,494 6,396
Effect of contracts monitored but not owned .... (64) (64) (66) (64) (81)
Metric excluding contracts monitored but not
owned ................................ 6,313 6,352 6,382 6,430 6,315
Average revenue per customer (dollars)(1)
June 27,
2014
March 28,
2014
December 27,
2013
September 27,
2013
September 28,
2012
Previously reported/revised metric(2) .......... $41.85 $41.05 $40.63 $40.47 $39.03
Effect of contracts monitored but not owned .... 0.35 0.35 0.35 0.33 0.41
Metric excluding contracts monitored but not
owned ................................ $42.20 $41.40 $40.98 $40.80 $39.44
(1) The ending number of customers and average revenue per customer are as of the respective quarters ended.
(2) Includes Canadian revision described above for fiscal years ended 2013 and 2012.
41