ADT 2014 Annual Report Download - page 134
Download and view the complete annual report
Please find page 134 of the 2014 ADT annual report below. You can navigate through the pages in the report by either clicking on the pages listed below, or by using the keyword search tool below to find specific information within the annual report.-
 1
1 -
2
-
3
-
4
-
5
-
6
-
7
-
8
-
9
-
10
-
11
-
12
-
13
-
14
-
15
-
16
-
17
-
18
-
19
-
20
-
21
-
22
-
23
-
24
-
25
-
26
-
27
-
28
-
29
-
30
-
31
-
32
-
33
-
34
-
35
-
36
-
37
-
38
-
39
-
40
-
41
-
42
-
43
-
44
-
45
-
46
-
47
-
48
-
49
-
50
-
51
-
52
-
53
-
54
-
55
-
56
-
57
-
58
-
59
-
60
-
61
-
62
-
63
-
64
-
65
-
66
-
67
-
68
-
69
-
70
-
71
-
72
-
73
-
74
-
75
-
76
-
77
-
78
-
79
-
80
-
81
-
82
-
83
-
84
-
85
-
86
-
87
-
88
-
89
-
90
-
91
-
92
-
93
-
94
-
95
-
96
-
97
-
98
-
99
-
100
-
101
-
102
-
103
-
104
-
105
-
106
-
107
-
108
-
109
-
110
-
111
-
112
-
113
-
114
-
115
-
116
-
117
-
118
-
119
-
120
-
121
-
122
-
123
-
 124
124 -
 125
125 -
 126
126 -
 127
127 -
 128
128 -
 129
129 -
 130
130 -
 131
131 -
 132
132 -
 133
133 -
 134
134 -
 135
135 -
 136
136 -
 137
137 -
 138
138 -
 139
139 -
 140
140 -
 141
141 -
 142
142 -
 143
143 -
 144
144 -
145
-
146
-
147
-
148
-
149
-
150
-
151
-
152
-
153
-
154
-
155
-
156
-
157
-
158
-
159
-
160
-
161
-
162
-
163
-
164
-
165
-
166
-
167
-
168
-
169
-
170
-
171
-
172
 |
 |

FORM 10-K
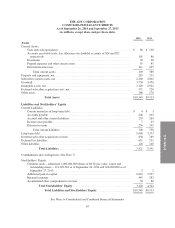
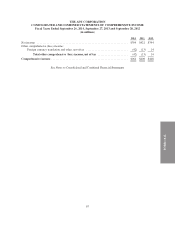
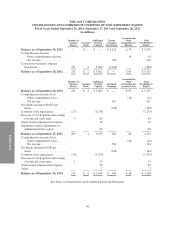
THE ADT CORPORATION
CONSOLIDATED AND COMBINED STATEMENTS OF STOCKHOLDERS’ EQUITY
Fiscal Years Ended September 26, 2014, September 27, 2013 and September 28, 2012
(in millions)
Number of
Common
Shares
Common
Stock
Additional
Paid-In
Capital
Parent
Company
Investment
Accumulated
Other
Comprehensive
Income
Total
Stockholders’
Equity
Balance as of September 30, 2011 . . — $— $ — $ 5,152 $ 79 $ 5,231
Comprehensive income:
Other comprehensive income . . . 14 14
Net income ................. 394 394
Conversion of parent company
investment .................... 231 2 5,062 (5,546) (482)
Balance as of September 28, 2012 . . 231 $ 2 $ 5,062 $ — $ 93 $ 5,157
Number of
Common
Shares
Common
Stock
Additional
Paid-In
Capital
Retained
Earnings
Accumulated
Other
Comprehensive
Income (Loss)
Total
Stockholders’
Equity
Balance as of September 28, 2012 . . 231 $ 2 $ 5,062 $ — $ 93 $ 5,157
Comprehensive income (loss):
Other comprehensive loss ...... (13) (13)
Net income ................. 421 421
Dividends declared ($0.625 per
share) ........................ (138) (138)
Common stock repurchases ........ (27) (1,274) (1,274)
Exercise of stock options and vesting
of restricted stock units .......... 5 85 85
Stock-based compensation expense . . 19 19
Separation-related adjustments to
additional paid-in capital ......... 65 65
Balance as of September 27, 2013 . . 209 2 3,957 283 80 4,322
Comprehensive income (loss):
Other comprehensive loss ...... (42) (42)
Net income ................. 304 304
Dividends declared ($0.80 per
share) ........................ (142) (142)
Common stock repurchases ........ (36) (1,353) (1,353)
Exercise of stock options and vesting
of restricted stock units .......... 1 17 17
Stock-based compensation expense . . 20 20
Other .......................... 2 2
Balance as of September 26, 2014 . . 174 $ 2 $ 2,643 $ 445 $ 38 $ 3,128
See Notes to Consolidated and Combined Financial Statements
68