ADT 2014 Annual Report Download - page 101
Download and view the complete annual report
Please find page 101 of the 2014 ADT annual report below. You can navigate through the pages in the report by either clicking on the pages listed below, or by using the keyword search tool below to find specific information within the annual report.-
 1
1 -
 2
2 -
 3
3 -
 4
4 -
 5
5 -
 6
6 -
 7
7 -
 8
8 -
 9
9 -
 10
10 -
 11
11 -
 12
12 -
 13
13 -
 14
14 -
 15
15 -
 16
16 -
 17
17 -
 18
18 -
 19
19 -
 20
20 -
 21
21 -
 22
22 -
 23
23 -
 24
24 -
 25
25 -
 26
26 -
 27
27 -
 28
28 -
 29
29 -
 30
30 -
 31
31 -
 32
32 -
 33
33 -
 34
34 -
 35
35 -
 36
36 -
 37
37 -
 38
38 -
 39
39 -
 40
40 -
 41
41 -
 42
42 -
 43
43 -
 44
44 -
 45
45 -
 46
46 -
 47
47 -
 48
48 -
 49
49 -
 50
50 -
 51
51 -
 52
52 -
 53
53 -
 54
54 -
 55
55 -
 56
56 -
 57
57 -
 58
58 -
 59
59 -
 60
60 -
 61
61 -
 62
62 -
 63
63 -
 64
64 -
 65
65 -
 66
66 -
 67
67 -
 68
68 -
 69
69 -
 70
70 -
 71
71 -
 72
72 -
 73
73 -
 74
74 -
 75
75 -
 76
76 -
 77
77 -
 78
78 -
 79
79 -
 80
80 -
 81
81 -
 82
82 -
 83
83 -
 84
84 -
 85
85 -
 86
86 -
 87
87 -
 88
88 -
 89
89 -
 90
90 -
 91
91 -
 92
92 -
 93
93 -
 94
94 -
 95
95 -
 96
96 -
 97
97 -
 98
98 -
 99
99 -
 100
100 -
 101
101 -
 102
102 -
 103
103 -
 104
104 -
 105
105 -
 106
106 -
 107
107 -
 108
108 -
 109
109 -
 110
110 -
 111
111 -
 112
112 -
 113
113 -
 114
114 -
 115
115 -
 116
116 -
 117
117 -
 118
118 -
 119
119 -
 120
120 -
 121
121 -
 122
122 -
 123
123 -
 124
124 -
 125
125 -
 126
126 -
 127
127 -
 128
128 -
 129
129 -
 130
130 -
 131
131 -
 132
132 -
 133
133 -
 134
134 -
 135
135 -
 136
136 -
 137
137 -
 138
138 -
 139
139 -
 140
140 -
 141
141 -
 142
142 -
 143
143 -
 144
144 -
 145
145 -
 146
146 -
 147
147 -
 148
148 -
 149
149 -
 150
150 -
 151
151 -
 152
152 -
 153
153 -
 154
154 -
 155
155 -
 156
156 -
 157
157 -
 158
158 -
 159
159 -
 160
160 -
 161
161 -
 162
162 -
 163
163 -
 164
164 -
 165
165 -
 166
166 -
 167
167 -
 168
168 -
 169
169 -
 170
170 -
 171
171 -
 172
172
 |
 |

FORM 10-K
Performance Graph
The following graph provides a comparison of the cumulative total shareholder return on the Company’s
common stock to the returns of Standard & Poor’s (S&P) 500 and the S&P 500 Industrial Index from October 1,
2012 (the first day of fiscal year 2013) through September 26, 2014. The graph is not, and is not intended to be,
indicative of future performance of our common stock. This graph is not being filed with the SEC as part of this
Annual Report on Form 10-K and is not to be incorporated by reference into any filing of the Company under the
Securities Act of 1933 or the Securities Exchange Act of 1934 (whether made before or after the date of this
Annual Report on Form 10-K, irrespective of any general incorporation language contained in such filing).
$100
$120
$140
$160
ADT
$20
$40
$60
$80
ADT
S&P500
S&P 500 Industrials
$0
Oct-12 Jan-13 Apr-13 Jul-13 Oct-13 Jan-14 Apr-14 Jul-14 Sep - 14
The above graph assumes the following:
(1) $100 invested at the close of business on October 1, 2012, in ADT common stock, S&P 500 Index, and
the S&P 500 Industrial Index.
(2) The cumulative total return assumes reinvestment of dividends.
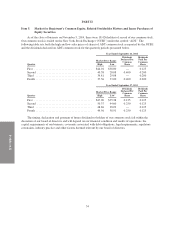
Issuer Purchases of Equity Securities
Period
Total Number of
Shares
Purchased
Average Price
Paid Per Share
Total Number
of Shares
Purchased as
Part of
Publicly
Announced
Plans or
Programs
Maximum
Approximate
Dollar Value of
Shares that
May Yet Be
Purchased
Under the
Plans or
Programs
06/28/14 – 07/25/14 ............ — $— — $380,805,210
07/26/14 – 08/29/14 ............ — $— — $380,805,210
08/30/14 – 09/26/14 ............ — $— — $380,805,210
Total ........................ — $— — $380,805,210
35
