ADT 2014 Annual Report Download - page 106
Download and view the complete annual report
Please find page 106 of the 2014 ADT annual report below. You can navigate through the pages in the report by either clicking on the pages listed below, or by using the keyword search tool below to find specific information within the annual report.-
 1
1 -
2
-
3
-
4
-
5
-
6
-
7
-
8
-
9
-
10
-
11
-
12
-
13
-
14
-
15
-
16
-
17
-
18
-
19
-
20
-
21
-
22
-
23
-
24
-
25
-
26
-
27
-
28
-
29
-
30
-
31
-
32
-
33
-
34
-
35
-
36
-
37
-
38
-
39
-
40
-
41
-
42
-
43
-
44
-
45
-
46
-
47
-
48
-
49
-
50
-
51
-
52
-
53
-
54
-
55
-
56
-
57
-
58
-
59
-
60
-
61
-
62
-
63
-
64
-
65
-
66
-
67
-
68
-
69
-
70
-
71
-
72
-
73
-
74
-
75
-
76
-
77
-
78
-
79
-
80
-
81
-
82
-
83
-
84
-
85
-
86
-
87
-
88
-
89
-
90
-
91
-
92
-
93
-
94
-
95
-
 96
96 -
 97
97 -
 98
98 -
 99
99 -
 100
100 -
 101
101 -
 102
102 -
 103
103 -
 104
104 -
 105
105 -
 106
106 -
 107
107 -
 108
108 -
 109
109 -
 110
110 -
 111
111 -
 112
112 -
 113
113 -
 114
114 -
 115
115 -
 116
116 -
117
-
118
-
119
-
120
-
121
-
122
-
123
-
124
-
125
-
126
-
127
-
128
-
129
-
130
-
131
-
132
-
133
-
134
-
135
-
136
-
137
-
138
-
139
-
140
-
141
-
142
-
143
-
144
-
145
-
146
-
147
-
148
-
149
-
150
-
151
-
152
-
153
-
154
-
155
-
156
-
157
-
158
-
159
-
160
-
161
-
162
-
163
-
164
-
165
-
166
-
167
-
168
-
169
-
170
-
171
-
172
 |
 |

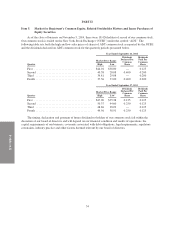
FORM 10-K
advertisements, Internet advertising and through a direct sales force and an authorized dealer network. The key
customer metrics that we use to track customer growth are gross customer additions and ending customers. Gross
customer additions are new monitored customers installed or acquired during the period.
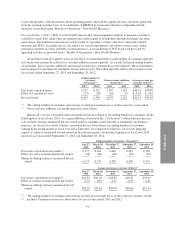
Customer Unit Attrition Rate. Our economic model is highly dependent on customer retention. Success in
retaining customers is driven in part by our discipline in accepting new customers with favorable characteristics
and by providing high quality equipment, installation, monitoring and customer service. Beginning with the
second quarter of fiscal 2014, we began to provide customer unit attrition rate as a key performance measure as
we believe that this metric supplements customer revenue attrition by providing additional information on the
economic impact of the security investments we make in residential and small business sites and is also used
internally, along with customer revenue attrition, to manage attrition.
Customer unit attrition measures residential and small business customer sites canceled, excluding health
services and contracts monitored but not owned, net of dealer charge-backs and re-sales. Customer sites are
considered canceled when all services are terminated. Dealer charge-backs represent customer cancellations
charged back to the dealers because the customer canceled service during the charge-back period, generally 13
months. Re-sales are inactive customer sites that are returned to active service during the period. The customer
unit attrition rate is a 52-week trailing ratio, the numerator of which is the trailing twelve month customer sites
canceled during the period due to attrition, net of charge-backs and re-sales, and the denominator of which is the
average of the customer base at the beginning of each month during the trailing twelve month period.
Customer Revenue Attrition Rate. We also evaluate our customer retention based upon the recurring revenue lost
resulting from customer attrition, net of dealer charge-backs and re-sales, which we refer to as customer revenue
attrition. The customer revenue attrition rate is a 52-week trailing ratio, the numerator of which is the annualized
recurring revenue lost during the period due to attrition, net of dealer charge-backs and re-sales, and the
denominator of which is total annualized recurring revenue based on an average of recurring revenue under
contract at the beginning of each month during the period.
Recurring Customer Revenue. Recurring customer revenue is generated by contractual monthly recurring fees for
monitoring and other recurring services provided to our customers. Our other revenue consists of revenue
associated with the sale of equipment, amortization of deferred revenue related to upfront fees, non-routine repair
and maintenance services and customer termination charges.
Average Revenue per Customer. Average revenue per customer measures the average amount of recurring
revenue per customer per month and is calculated based on the recurring revenue under contract at the end of the
period, divided by the total number of customers under contract at the end of the period.
Cost to Serve Expenses. Cost to serve expenses represent the cost of providing services to our customers reflected
in our Consolidated and Combined Statements of Operations. These expenses include costs associated with
service calls for customers who have maintenance contracts, costs of monitoring, call center customer service
and guard response, partnership commissions and continuing equity programs, bad debt expense and general and
administrative expenses. Recurring customer revenue less cost to serve expenses represents our recurring revenue
margin.
Gross Subscriber Acquisition Cost Expenses. Gross subscriber acquisition cost expenses represent certain costs
related to the acquisition of new customers reflected in our Consolidated and Combined Statements of
Operations such as advertising, marketing, and both direct and indirect selling costs for all new customer
accounts as well as sales commissions and installation equipment and labor costs associated with transactions
where title to the security system is contractually transferred to the customer.
Earnings before interest, taxes, depreciation and amortization (“EBITDA”). EBITDA is a non-GAAP measure
reflecting net income adjusted for interest, taxes and certain non-cash items which include depreciation of
subscriber system assets and other fixed assets, amortization of deferred costs and deferred revenue associated
with customer acquisitions, and amortization of dealer and other intangible assets. We believe EBITDA is useful
40