ADT 2014 Annual Report Download - page 162
Download and view the complete annual report
Please find page 162 of the 2014 ADT annual report below. You can navigate through the pages in the report by either clicking on the pages listed below, or by using the keyword search tool below to find specific information within the annual report.-
 1
1 -
2
-
3
-
4
-
5
-
6
-
7
-
8
-
9
-
10
-
11
-
12
-
13
-
14
-
15
-
16
-
17
-
18
-
19
-
20
-
21
-
22
-
23
-
24
-
25
-
26
-
27
-
28
-
29
-
30
-
31
-
32
-
33
-
34
-
35
-
36
-
37
-
38
-
39
-
40
-
41
-
42
-
43
-
44
-
45
-
46
-
47
-
48
-
49
-
50
-
51
-
52
-
53
-
54
-
55
-
56
-
57
-
58
-
59
-
60
-
61
-
62
-
63
-
64
-
65
-
66
-
67
-
68
-
69
-
70
-
71
-
72
-
73
-
74
-
75
-
76
-
77
-
78
-
79
-
80
-
81
-
82
-
83
-
84
-
85
-
86
-
87
-
88
-
89
-
90
-
91
-
92
-
93
-
94
-
95
-
96
-
97
-
98
-
99
-
100
-
101
-
102
-
103
-
104
-
105
-
106
-
107
-
108
-
109
-
110
-
111
-
112
-
113
-
114
-
115
-
116
-
117
-
118
-
119
-
120
-
121
-
122
-
123
-
124
-
125
-
126
-
127
-
128
-
129
-
130
-
131
-
132
-
133
-
134
-
135
-
136
-
137
-
138
-
139
-
140
-
141
-
142
-
143
-
144
-
145
-
146
-
147
-
148
-
149
-
150
-
151
-
 152
152 -
 153
153 -
 154
154 -
 155
155 -
 156
156 -
 157
157 -
 158
158 -
 159
159 -
 160
160 -
 161
161 -
 162
162 -
 163
163 -
 164
164 -
 165
165 -
 166
166 -
 167
167 -
 168
168 -
 169
169 -
 170
170 -
 171
171 -
 172
172
 |
 |

FORM 10-K
Separation, the Company had 231,094,332 common shares outstanding. This amount was used as the starting
point for calculating weighted-average shares outstanding for fiscal year 2012. Additionally, diluted weighted-
average shares outstanding for fiscal year 2012 was determined assuming that the Separation occurred on the first
day of fiscal year 2012. The computation of basic and diluted earnings per share for fiscal years 2014, 2013 and
2012 is as follows:
(in millions, except per share amounts) 2014 2013 2012
Basic Earnings Per Share
Numerator:
Net income ....................................... $304 $421 $394
Denominator:
Weighted-average shares outstanding .................. 182 222 231
Effect of vested deferred stock units ............... — — 1
Basic weighted-average shares outstanding .............. 182 222 232
Basic earnings per share ................................. $1.67 $1.90 $1.70
Diluted Earnings Per Share
Numerator:
Net income ....................................... $304 $421 $394
Denominator:
Basic weighted-average shares outstanding .............. 182 222 232
Effect of dilutive securities:
Stock options .............................112
Restricted stock ........................... — 1 2
Diluted weighted-average shares outstanding ............ 183 224 236
Diluted earnings per share ............................... $1.66 $1.88 $1.67
The computation of diluted earnings per share excludes the effect of the potential exercise of options to
purchase approximately 1.7 million shares of stock for fiscal year 2014 and 0.8 million shares of stock for fiscal
years 2013 and 2012, as the effect would have been anti-dilutive.
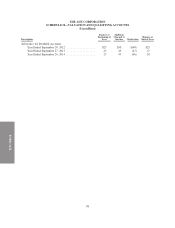
12. Geographic Data
Revenues are attributed to individual countries based upon the operating entity that records the transaction.
Revenue by geographic area for fiscal years 2014, 2013 and 2012 are as follows ($ in millions):
Revenue 2014 2013 2012
United States ...................................... $3,206 $3,123 $3,034
Canada ........................................... 202 186 194
Total ......................................... $3,408 $3,309 $3,228
Long-lived assets, which are comprised of subscriber system assets, net and property and equipment, net,
located in the United States approximate 94% and 93% of total long-lived assets as of September 26, 2014
and September 27, 2013, respectively, with the remainder residing in Canada.
96