Singapore Airlines 2015 Annual Report Download - page 97
Download and view the complete annual report
Please find page 97 of the 2015 Singapore Airlines annual report below. You can navigate through the pages in the report by either clicking on the pages listed below, or by using the keyword search tool below to find specific information within the annual report.-
 1
1 -
2
-
3
-
4
-
5
-
6
-
7
-
8
-
9
-
10
-
11
-
12
-
13
-
14
-
15
-
16
-
17
-
18
-
19
-
20
-
21
-
22
-
23
-
24
-
25
-
26
-
27
-
28
-
29
-
30
-
31
-
32
-
33
-
34
-
35
-
36
-
37
-
38
-
39
-
40
-
41
-
42
-
43
-
44
-
45
-
46
-
47
-
48
-
49
-
50
-
51
-
52
-
53
-
54
-
55
-
56
-
57
-
58
-
59
-
60
-
61
-
62
-
63
-
64
-
65
-
66
-
67
-
68
-
69
-
70
-
71
-
72
-
73
-
74
-
75
-
76
-
77
-
78
-
79
-
80
-
81
-
82
-
83
-
84
-
85
-
86
-
 87
87 -
 88
88 -
 89
89 -
 90
90 -
 91
91 -
 92
92 -
 93
93 -
 94
94 -
 95
95 -
 96
96 -
 97
97 -
 98
98 -
 99
99 -
 100
100 -
 101
101 -
 102
102 -
 103
103 -
 104
104 -
 105
105 -
 106
106 -
 107
107 -
108
-
109
-
110
-
111
-
112
-
113
-
114
-
115
-
116
-
117
-
118
-
119
-
120
-
121
-
122
-
123
-
124
-
125
-
126
-
127
-
128
-
129
-
130
-
131
-
132
-
133
-
134
-
135
-
136
-
137
-
138
-
139
-
140
-
141
-
142
-
143
-
144
-
145
-
146
-
147
-
148
-
149
-
150
-
151
-
152
-
153
-
154
-
155
-
156
-
157
-
158
-
159
-
160
-
161
-
162
-
163
-
164
-
165
-
166
-
167
-
168
-
169
-
170
-
171
-
172
-
173
-
174
-
175
-
176
-
177
-
178
-
179
-
180
-
181
-
182
-
183
-
184
-
185
-
186
-
187
-
188
-
189
-
190
-
191
-
192
-
193
-
194
-
195
-
196
-
197
-
198
-
199
-
200
-
201
-
202
-
203
-
204
-
205
-
206
-
207
-
208
-
209
-
210
-
211
-
212
-
213
-
214
-
215
-
216
-
217
-
218
-
219
-
220
-
221
-
222
-
223
-
224
 |
 |

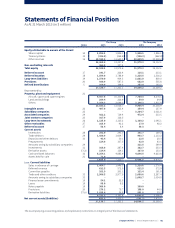
The Group The Company
Notes 2015 2014 2015 2014
Equity attributable to owners of the Parent
Share capital 14 1,856.1 1,856.1 1,856.1 1,856.1
Treasury shares 15 (326.3) (262.2) (326.3) (262.2)
Other reserves 16 10,933.8 11,643.3 10,049.5 10,518.2
12,463.6 13,237.2 11,579.3 12,112.1
Non-controlling interests 466.5 337.4 ––
Total equity 12,930.1 13,574.6 11,579.3 12,112.1
Deferred account 17 141.7 226.4 115.1 213.1
Deferred taxation 18 1,599.6 1,788.9 1,325.5 1,516.2
Long-term liabilities 19 1,370.0 904.3 1,001.0 800.0
Provisions 20 936.9 587.3 682.9 555.8
Defined benefit plans 5160.4 169.6 152.4 162.0
17,138.7 17,251.1 14,856.2 15,359.2
Represented by:
Property, plant and equipment 21
Aircraft, spares and spare engines 9,957.5 10,100.8 7,700.3 8,378.1
Land and buildings 209.4 226.9 59.9 64.9
Others 3,356.3 2,699.0 2,146.2 1,815.9
13,523.2 13,026.7 9,906.4 10,258.9
Intangible assets 22 497.6 223.4 159.4 157.9
Subsidiary companies 23 ––3,364.7 2,021.6
Associated companies 24 922.2 729.4 472.4 313.5
Joint venture companies 25 167.9 126.5 ––
Long-term investments 26 1,125.0 1,125.2 1,100.2 1,045.1
Other receivables 27 163.9 92.2 17.9 92.2
Deferred account 17 56.4 8.4 36.3 –
Current assets
Inventories 28 202.0 243.0 131.7 169.2
Trade debtors 29 1,486.9 1,604.7 993.7 1,113.2
Deposits and other debtors 30 43.4 50.1 22.5 20.3
Prepayments 124.6 107.5 92.9 83.5
Amounts owing by subsidiary companies 29 ––311.5 599.9
Investments 31 168.6 287.4 102.7 233.3
Derivative assets 37(a) 114.4 134.1 107.0 133.3
Cash and bank balances 32 5,254.1 4,883.9 4,646.5 4,623.8
Assets held for sale 21 71.0 –––
7,465.0 7,310.7 6,408.5 6,976.5
Less: Current liabilities
Sales in advance of carriage 1,464.7 1,446.3 1,328.6 1,376.4
Deferred revenue 612.5 572.9 612.5 572.9
Current tax payable 161.9 201.1 111.4 161.8
Trade and other creditors 33 2,906.5 2,977.9 2,088.6 2,287.4
Amounts owing to subsidiary companies 33 ––1,048.7 1,034.8
Finance lease commitments 19 54.1 52.5 ––
Loans 19 93.0 8.2 ––
Notes payable 19 300.0 –300.0 –
Provisions 20 170.2 75.7 138.0 44.0
Derivative liabilities 37(a) 1,019.6 56.8 981.8 29.2
6,782.5 5,391.4 6,609.6 5,506.5
Net current assets/(liabilities) 682.5 1,919.3 (201.1) 1,470.0
17,138.7 17,251.1 14,856.2 15,359.2
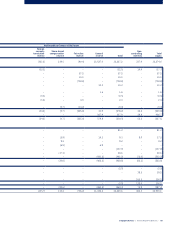
Statements of Financial Position
As At 31 March 2015 (in $ million)
The accompanying accounting policies and explanatory notes form an integral part of the financial statements.
Singapore Airlines | Annual Report FY2014/15 |95