Singapore Airlines 2015 Annual Report Download - page 61
Download and view the complete annual report
Please find page 61 of the 2015 Singapore Airlines annual report below. You can navigate through the pages in the report by either clicking on the pages listed below, or by using the keyword search tool below to find specific information within the annual report.-
 1
1 -
2
-
3
-
4
-
5
-
6
-
7
-
8
-
9
-
10
-
11
-
12
-
13
-
14
-
15
-
16
-
17
-
18
-
19
-
20
-
21
-
22
-
23
-
24
-
25
-
26
-
27
-
28
-
29
-
30
-
31
-
32
-
33
-
34
-
35
-
36
-
37
-
38
-
39
-
40
-
41
-
42
-
43
-
44
-
45
-
46
-
47
-
48
-
49
-
50
-
 51
51 -
 52
52 -
 53
53 -
 54
54 -
 55
55 -
 56
56 -
 57
57 -
 58
58 -
 59
59 -
 60
60 -
 61
61 -
 62
62 -
 63
63 -
 64
64 -
 65
65 -
 66
66 -
 67
67 -
 68
68 -
 69
69 -
 70
70 -
 71
71 -
72
-
73
-
74
-
75
-
76
-
77
-
78
-
79
-
80
-
81
-
82
-
83
-
84
-
85
-
86
-
87
-
88
-
89
-
90
-
91
-
92
-
93
-
94
-
95
-
96
-
97
-
98
-
99
-
100
-
101
-
102
-
103
-
104
-
105
-
106
-
107
-
108
-
109
-
110
-
111
-
112
-
113
-
114
-
115
-
116
-
117
-
118
-
119
-
120
-
121
-
122
-
123
-
124
-
125
-
126
-
127
-
128
-
129
-
130
-
131
-
132
-
133
-
134
-
135
-
136
-
137
-
138
-
139
-
140
-
141
-
142
-
143
-
144
-
145
-
146
-
147
-
148
-
149
-
150
-
151
-
152
-
153
-
154
-
155
-
156
-
157
-
158
-
159
-
160
-
161
-
162
-
163
-
164
-
165
-
166
-
167
-
168
-
169
-
170
-
171
-
172
-
173
-
174
-
175
-
176
-
177
-
178
-
179
-
180
-
181
-
182
-
183
-
184
-
185
-
186
-
187
-
188
-
189
-
190
-
191
-
192
-
193
-
194
-
195
-
196
-
197
-
198
-
199
-
200
-
201
-
202
-
203
-
204
-
205
-
206
-
207
-
208
-
209
-
210
-
211
-
212
-
213
-
214
-
215
-
216
-
217
-
218
-
219
-
220
-
221
-
222
-
223
-
224
 |
 |

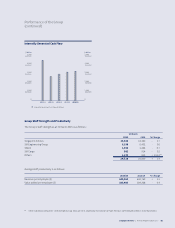
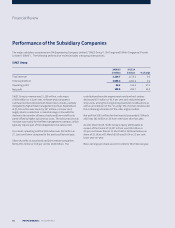
SIA Cargo’s revenue declined by $13 million (-0.6 per cent)
against last year to $2,241 million, notwithstanding a higher
load factor (+0.8 percentage point) and yield (+0.3 per cent),
largely due to a 2.4 per cent reduction in capacity. Expenditure
decreased $91 million (-3.9 per cent) arising from the reduction
in fuel cost and depreciation with the removal of four freighters
from the operating fleet. This translated to an operating loss
of $22 million for 2014/15, an improvement of $78 million as
compared to a year ago.
In 2014/15, cargo capacity (in capacity tonne kilometers)
dropped 2.4 per cent as a result of rationalisation eorts in
response to excess capacity in the air cargo market, while
overall cargo traic (in load tonne kilometers) dropped by
1.1 per cent, resulting in an improvement in cargo load factor
by 0.8 percentage point to 63.3 per cent. Cargo breakeven load
factor improved by 1.8 percentage points to 65.2 per cent due to
lower unit cost (-2.3 per cent) and stronger yields (+0.3 per cent).
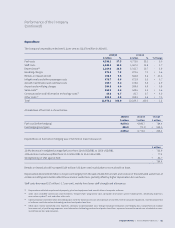
The exceptional items in 2014/15 pertained mainly to
impairment loss of $64 million on its investment in China
Cargo Airlines, a provision of USD10 million ($14 million)
for settlement with a customer to resolve all pending and
potential civil damage claims regarding the air cargo issues,
and additional impairment loss of $7 million on two surplus
freighters removed from the operating fleet. These were
oset by a partial refund of $1 million from the South Korean
Fair Trade Commission being part of the fine amount paid
previously, following SIA Cargo’s appeal.
As at 31 March 2015, SIA Cargo operated a fleet of eight 747-400
freighters. SIA Cargo’s equity was $751 million (-15.5 per cent).
SIA Cargo
2014/15 2013/14
$ million $ million % Change
Total revenue 2,240.8 2,253.7 - 0.6
Total expenditure 2,262.8 2,354.1 - 3.9
Operating loss (22.0) (100.4) + 78.1
Exceptional items (83.3) (380.4) + 78.1
Loss aer taxation (99.7) (418.3) + 76.2
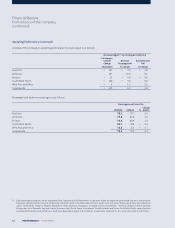
SilkAir’s revenue increased by $46 million (+5.4 per cent)
to $903 million, as passenger revenue was boosted by a
6.3 per cent improvement in passenger carriage and a 1.5 per cent
improvement in passenger yield. The increase in expenditure of
$40 million (+4.8 per cent) was primarily due to higher aircra
standing charges and payroll costs. As a result, the operating
profit increased by $6 million (+18.3 per cent) to $41 million.
Yield increased 1.5 per cent to 13.9 ¢/pkm and unit cost
declined by 1.0 per cent to 9.7 ¢/ask. Consequently, the
breakeven load factor improved by 1.7 percentage points
to 69.8 per cent.
Profit aer taxation improved 44.7 per cent to $54 million.
SilkAir’s route network spanned 48 cities in 12 countries
including Singapore. During the year, SilkAir launched
new services to Kalibo (Philippines), Mandalay (Myanmar),
Hangzhou (China) and Denpasar (Indonesia).
As at 31 March 2015, equity holders’ funds of SilkAir stood at
$829 million (+2.1 per cent).
SilkAir
2014/15 2013/14
$ million $ million % Change
Total revenue 902.5 856.6 + 5.4
Total expenditure 861.7 822.1 + 4.8
Operating profit 40.8 34.5 + 18.3
Profit aer taxation 53.7 37.1 + 44.7
Singapore Airlines | Annual Report FY2014/15 | 59