Singapore Airlines 2015 Annual Report Download - page 58
Download and view the complete annual report
Please find page 58 of the 2015 Singapore Airlines annual report below. You can navigate through the pages in the report by either clicking on the pages listed below, or by using the keyword search tool below to find specific information within the annual report.-
 1
1 -
2
-
3
-
4
-
5
-
6
-
7
-
8
-
9
-
10
-
11
-
12
-
13
-
14
-
15
-
16
-
17
-
18
-
19
-
20
-
21
-
22
-
23
-
24
-
25
-
26
-
27
-
28
-
29
-
30
-
31
-
32
-
33
-
34
-
35
-
36
-
37
-
38
-
39
-
40
-
41
-
42
-
43
-
44
-
45
-
46
-
47
-
 48
48 -
 49
49 -
 50
50 -
 51
51 -
 52
52 -
 53
53 -
 54
54 -
 55
55 -
 56
56 -
 57
57 -
 58
58 -
 59
59 -
 60
60 -
 61
61 -
 62
62 -
 63
63 -
 64
64 -
 65
65 -
 66
66 -
 67
67 -
 68
68 -
69
-
70
-
71
-
72
-
73
-
74
-
75
-
76
-
77
-
78
-
79
-
80
-
81
-
82
-
83
-
84
-
85
-
86
-
87
-
88
-
89
-
90
-
91
-
92
-
93
-
94
-
95
-
96
-
97
-
98
-
99
-
100
-
101
-
102
-
103
-
104
-
105
-
106
-
107
-
108
-
109
-
110
-
111
-
112
-
113
-
114
-
115
-
116
-
117
-
118
-
119
-
120
-
121
-
122
-
123
-
124
-
125
-
126
-
127
-
128
-
129
-
130
-
131
-
132
-
133
-
134
-
135
-
136
-
137
-
138
-
139
-
140
-
141
-
142
-
143
-
144
-
145
-
146
-
147
-
148
-
149
-
150
-
151
-
152
-
153
-
154
-
155
-
156
-
157
-
158
-
159
-
160
-
161
-
162
-
163
-
164
-
165
-
166
-
167
-
168
-
169
-
170
-
171
-
172
-
173
-
174
-
175
-
176
-
177
-
178
-
179
-
180
-
181
-
182
-
183
-
184
-
185
-
186
-
187
-
188
-
189
-
190
-
191
-
192
-
193
-
194
-
195
-
196
-
197
-
198
-
199
-
200
-
201
-
202
-
203
-
204
-
205
-
206
-
207
-
208
-
209
-
210
-
211
-
212
-
213
-
214
-
215
-
216
-
217
-
218
-
219
-
220
-
221
-
222
-
223
-
224
 |
 |

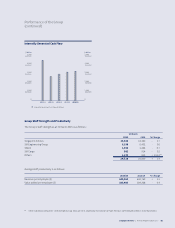
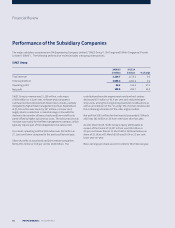
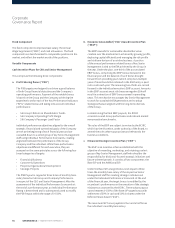
Fuel Productivity and Sensitivity Analysis
Fuel productivity as measured by load tonne-km per barrel
(ltk/BBL) improved 1.2 per cent over the previous year to
429ltk/BBL. This was largely due to the cessation of the ultra
long-haul direct flights to Americas.
A change in fuel productivity (passenger aircra) of 1.0 per cent
would impact the Company’s annual fuel cost by about
$44 million, before accounting for changes in fuel price,
US dollar exchange rate and flying operations.
A change in the price of fuel of one US dollar per barrel aects
the Company’s annual fuel cost by about $42 million, before
accounting for US dollar exchange rate movements, and
changes in volume of fuel consumed.
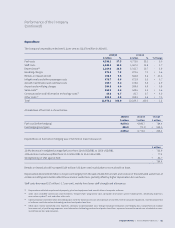
Finance Charges
In 2014/15, finance charges rose $10 million or 31.0 per cent,
mainly due to interest expense incurred on the $500 million
notes issued in April 2014.
Interest Income
Interest income was $15 million or 23.3 per cent higher, largely
due to higher interest from short-term deposits, bonds, fixed
rate notes and investment funds.
Surplus on Disposal of Aircra, Spares
and Spare Engines
The $37 million gain on disposal of aircra, spares and spare
engines arose mainly from the sale and leaseback of three
777-300ER and sale of one 777-200 aircra. Last year’s
$46 million gain on disposal was due mainly to sale of three
777-200 and five A340-500 aircra.
Other Non-operating Items
Other non-operating items in 2014/15 pertained mainly to
impairment losses ($43 million) on the Company’s investment
in Singapore Flying College Pte Ltd being written down to its
estimated recoverable amount, and two grounded 777-200
aircra ($22 million). Last year’s non-operating items comprised
largely impairment loss of $54 million recorded on the
Company’s investment in Tiger Airways being written down to
its fair market value.
Taxation
There was a net tax expense of $23 million, comprising current
tax charge of $85 million and deferred tax credit of $62 million.
As at 31 March 2015, the Company’s deferred taxation account
stood at $1,326 million.
Fuel Productivity of Passenger Fleet
2010/11 2011/12 2012/13 2013/14 2014/15
440
430
420
410
400
440
430
420
410
400
LTK/BBL LTK/BBL
Financial Review
Performance of the Company
(continued)
56 PERFORMANCE | Financial Review |