Singapore Airlines 2015 Annual Report Download - page 193
Download and view the complete annual report
Please find page 193 of the 2015 Singapore Airlines annual report below. You can navigate through the pages in the report by either clicking on the pages listed below, or by using the keyword search tool below to find specific information within the annual report.-
 1
1 -
2
-
3
-
4
-
5
-
6
-
7
-
8
-
9
-
10
-
11
-
12
-
13
-
14
-
15
-
16
-
17
-
18
-
19
-
20
-
21
-
22
-
23
-
24
-
25
-
26
-
27
-
28
-
29
-
30
-
31
-
32
-
33
-
34
-
35
-
36
-
37
-
38
-
39
-
40
-
41
-
42
-
43
-
44
-
45
-
46
-
47
-
48
-
49
-
50
-
51
-
52
-
53
-
54
-
55
-
56
-
57
-
58
-
59
-
60
-
61
-
62
-
63
-
64
-
65
-
66
-
67
-
68
-
69
-
70
-
71
-
72
-
73
-
74
-
75
-
76
-
77
-
78
-
79
-
80
-
81
-
82
-
83
-
84
-
85
-
86
-
87
-
88
-
89
-
90
-
91
-
92
-
93
-
94
-
95
-
96
-
97
-
98
-
99
-
100
-
101
-
102
-
103
-
104
-
105
-
106
-
107
-
108
-
109
-
110
-
111
-
112
-
113
-
114
-
115
-
116
-
117
-
118
-
119
-
120
-
121
-
122
-
123
-
124
-
125
-
126
-
127
-
128
-
129
-
130
-
131
-
132
-
133
-
134
-
135
-
136
-
137
-
138
-
139
-
140
-
141
-
142
-
143
-
144
-
145
-
146
-
147
-
148
-
149
-
150
-
151
-
152
-
153
-
154
-
155
-
156
-
157
-
158
-
159
-
160
-
161
-
162
-
163
-
164
-
165
-
166
-
167
-
168
-
169
-
170
-
171
-
172
-
173
-
174
-
175
-
176
-
177
-
178
-
179
-
180
-
181
-
182
-
 183
183 -
 184
184 -
 185
185 -
 186
186 -
 187
187 -
 188
188 -
 189
189 -
 190
190 -
 191
191 -
 192
192 -
 193
193 -
 194
194 -
 195
195 -
 196
196 -
 197
197 -
 198
198 -
 199
199 -
 200
200 -
 201
201 -
 202
202 -
 203
203 -
204
-
205
-
206
-
207
-
208
-
209
-
210
-
211
-
212
-
213
-
214
-
215
-
216
-
217
-
218
-
219
-
220
-
221
-
222
-
223
-
224
 |
 |

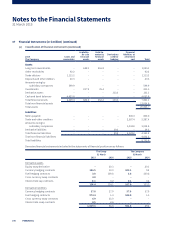
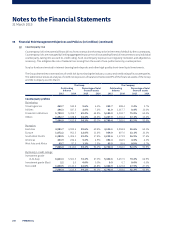
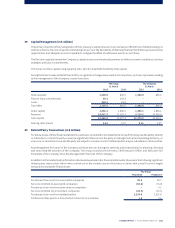
37 Financial Instruments (in $ million) (continued)
(b) Fair values
Financial instruments carried at fair value
Fair value hierarchy
The following table shows an analysis of financial instruments carried at fair value by level of fair value hierarchy:
The Group
31 March 2015 31 March 2014
Quoted
prices in
active markets
for identical
instruments
Significant
other
observable
inputs
Quoted
prices in
active markets
for identical
instruments
Significant
other
observable
inputs
Recurring fair value adjustments (Level 1) (Level 2) (Level 1) (Level 2)
Financial assets:
Available-for-sale investments
Quoted investments
– Government securities 8.6 – 3.7 –
– Equity investments 37.7 – 347.7 –
– Non-equity investments 118.3 – 186.2 –
Unquoted investments
– Non-equity investments – 303.6 – 323.9
Derivative assets
Equity swap derivative – – – 20.3
Currency hedging contracts – 106.5 – 10.0
Fuel hedging contracts – 3.8 – 100.6
Cross currency swap contracts – 4.0 – –
Interest rate cap contracts – 0.1 – 3.2
164.6 418.0 537.6 458.0
Financial liabilities:
Derivative liabilities
Currency hedging contracts – 37.8 – 27.9
Fuel hedging contracts – 974.4 – 1.3
Cross currency swap contracts – 6.9 – 25.0
Interest rate swap contracts – 0.5 – 2.6
– 1,019.6 – 56.8
The Group classifies fair value measurement using a fair value hierarchy that reflects the significance of the inputs used
in making the measurements. The fair value hierarchy has the following levels:
• Level1–Quotedprices(unadjusted)inactivemarketsforidenticalassetsorliabilities
• Level2–InputsotherthanquotedpricesincludedwithinLevel1thatareobservablefortheassetorliability,either
directly (i.e., as prices) or indirectly (i.e., derived from prices)
• Level3–Unobservableinputsfortheassetorliability
There has been no transfer between level 1 and level 2 during the financial year.
Singapore Airlines | Annual Report FY2014/15 |191