Singapore Airlines 2015 Annual Report Download - page 47
Download and view the complete annual report
Please find page 47 of the 2015 Singapore Airlines annual report below. You can navigate through the pages in the report by either clicking on the pages listed below, or by using the keyword search tool below to find specific information within the annual report.-
 1
1 -
2
-
3
-
4
-
5
-
6
-
7
-
8
-
9
-
10
-
11
-
12
-
13
-
14
-
15
-
16
-
17
-
18
-
19
-
20
-
21
-
22
-
23
-
24
-
25
-
26
-
27
-
28
-
29
-
30
-
31
-
32
-
33
-
34
-
35
-
36
-
 37
37 -
 38
38 -
 39
39 -
 40
40 -
 41
41 -
 42
42 -
 43
43 -
 44
44 -
 45
45 -
 46
46 -
 47
47 -
 48
48 -
 49
49 -
 50
50 -
 51
51 -
 52
52 -
 53
53 -
 54
54 -
 55
55 -
 56
56 -
 57
57 -
58
-
59
-
60
-
61
-
62
-
63
-
64
-
65
-
66
-
67
-
68
-
69
-
70
-
71
-
72
-
73
-
74
-
75
-
76
-
77
-
78
-
79
-
80
-
81
-
82
-
83
-
84
-
85
-
86
-
87
-
88
-
89
-
90
-
91
-
92
-
93
-
94
-
95
-
96
-
97
-
98
-
99
-
100
-
101
-
102
-
103
-
104
-
105
-
106
-
107
-
108
-
109
-
110
-
111
-
112
-
113
-
114
-
115
-
116
-
117
-
118
-
119
-
120
-
121
-
122
-
123
-
124
-
125
-
126
-
127
-
128
-
129
-
130
-
131
-
132
-
133
-
134
-
135
-
136
-
137
-
138
-
139
-
140
-
141
-
142
-
143
-
144
-
145
-
146
-
147
-
148
-
149
-
150
-
151
-
152
-
153
-
154
-
155
-
156
-
157
-
158
-
159
-
160
-
161
-
162
-
163
-
164
-
165
-
166
-
167
-
168
-
169
-
170
-
171
-
172
-
173
-
174
-
175
-
176
-
177
-
178
-
179
-
180
-
181
-
182
-
183
-
184
-
185
-
186
-
187
-
188
-
189
-
190
-
191
-
192
-
193
-
194
-
195
-
196
-
197
-
198
-
199
-
200
-
201
-
202
-
203
-
204
-
205
-
206
-
207
-
208
-
209
-
210
-
211
-
212
-
213
-
214
-
215
-
216
-
217
-
218
-
219
-
220
-
221
-
222
-
223
-
224
 |
 |

Key Financial Highlights
Performance of the Group
2014/15 2013/14 % Change
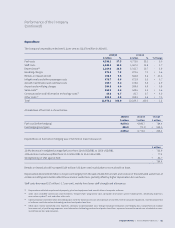
Earnings For The Year ($ million)
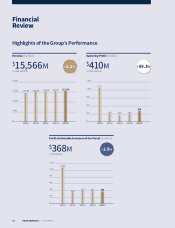
Revenue 15,565.5 15,243.9 + 2.1
Expenditure 15,156.1 14,984.6 + 1.1
Operating profit 409.4 259.3 + 57.9
Profit attributable to owners of the Parent 367.9 359.5 + 2.3
Per Share Data (cents)
Earnings per share – basic 31.4 30.6 + 2.6
Ordinary dividend per share 22.0 21.0 + 4.8
Special dividend per share –25.0 n.m.
Ratios (%)
Return on equity holders’ funds 2.9 2.7 + 0.2 point
Return on total assets 1.7 1.9 - 0.2 point
n.m. not meaningful
During the financial year, the operating landscape for the
aviation industry remained challenging with economic and
political instability in key markets, intense competition,
and currency fluctuations. Yields remained so as tactical
promotions were launched to boost loads. Unfavourable
foreign exchange movements for revenue-generating currencies
against the Singapore dollar pushed yields down, while
strengthening of the US dollar (a major expenditure currency)
against the Singapore dollar adversely impacted the Group’s
expenditure. These were partially mitigated by the steep fall in
fuel prices in the second half of the financial year which resulted
in significant reduction in net fuel cost, constituting about 37
per cent of the Group’s total operating expenditure.
With eect from October 2014, Tiger Airways Holdings Limited
(“Tiger Airways”) became a subsidiary of the Group, and
recorded an operating deficit of $9 million since consolidation
on the back of $357 million revenue against $366 million
operating expenditure.
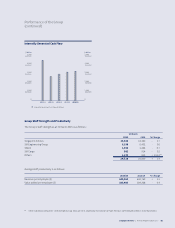
Excluding Tiger Airways, Group revenue declined marginally
(-0.2 per cent or -$35 million) against last year to $15,209
million. Passenger revenue rose as passenger carriage and
yields saw improvement of 0.2 per cent and 0.9 per cent
respectively. Cargo revenue was lower, largely due to a
2.4 per cent reduction in capacity. Engineering services revenue
declined with reduced overhaul activities, as did incidental
revenue with a reduction of aircra leasing income following
the expiry of leases to Royal Brunei Airlines, and lower
compensation pertaining to changes in aircra delivery slots.
The Group’s revenue (excluding Tiger Airways) by business
segment is shown below:
2014/15 2013/14
$ million $ million
Airline operations 12,498.7 12,444.7
Cargo operations 2,234.8 2,248.3
Engineering services 437.8 508.5
Others 37.2 42.4
Total revenue (excluding Tiger Airways) 15,208.5 15,243.9
Group Earnings
Singapore Airlines | Annual Report FY2014/15 | 45