Singapore Airlines 2015 Annual Report Download - page 59
Download and view the complete annual report
Please find page 59 of the 2015 Singapore Airlines annual report below. You can navigate through the pages in the report by either clicking on the pages listed below, or by using the keyword search tool below to find specific information within the annual report.-
 1
1 -
2
-
3
-
4
-
5
-
6
-
7
-
8
-
9
-
10
-
11
-
12
-
13
-
14
-
15
-
16
-
17
-
18
-
19
-
20
-
21
-
22
-
23
-
24
-
25
-
26
-
27
-
28
-
29
-
30
-
31
-
32
-
33
-
34
-
35
-
36
-
37
-
38
-
39
-
40
-
41
-
42
-
43
-
44
-
45
-
46
-
47
-
48
-
 49
49 -
 50
50 -
 51
51 -
 52
52 -
 53
53 -
 54
54 -
 55
55 -
 56
56 -
 57
57 -
 58
58 -
 59
59 -
 60
60 -
 61
61 -
 62
62 -
 63
63 -
 64
64 -
 65
65 -
 66
66 -
 67
67 -
 68
68 -
 69
69 -
70
-
71
-
72
-
73
-
74
-
75
-
76
-
77
-
78
-
79
-
80
-
81
-
82
-
83
-
84
-
85
-
86
-
87
-
88
-
89
-
90
-
91
-
92
-
93
-
94
-
95
-
96
-
97
-
98
-
99
-
100
-
101
-
102
-
103
-
104
-
105
-
106
-
107
-
108
-
109
-
110
-
111
-
112
-
113
-
114
-
115
-
116
-
117
-
118
-
119
-
120
-
121
-
122
-
123
-
124
-
125
-
126
-
127
-
128
-
129
-
130
-
131
-
132
-
133
-
134
-
135
-
136
-
137
-
138
-
139
-
140
-
141
-
142
-
143
-
144
-
145
-
146
-
147
-
148
-
149
-
150
-
151
-
152
-
153
-
154
-
155
-
156
-
157
-
158
-
159
-
160
-
161
-
162
-
163
-
164
-
165
-
166
-
167
-
168
-
169
-
170
-
171
-
172
-
173
-
174
-
175
-
176
-
177
-
178
-
179
-
180
-
181
-
182
-
183
-
184
-
185
-
186
-
187
-
188
-
189
-
190
-
191
-
192
-
193
-
194
-
195
-
196
-
197
-
198
-
199
-
200
-
201
-
202
-
203
-
204
-
205
-
206
-
207
-
208
-
209
-
210
-
211
-
212
-
213
-
214
-
215
-
216
-
217
-
218
-
219
-
220
-
221
-
222
-
223
-
224
 |
 |

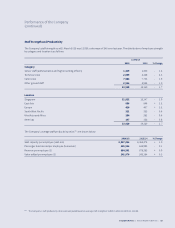
Sta Strength and Productivity
The Company’s sta strength as at 31 March 2015 was 13,920, a decrease of 240 over last year. The distribution of employee strength
by category and location is as follows:
31 March
2015 2014 % Change
Category
Senior sta (administrative and higher ranking oicers) 1,319 1,335 - 1.2
Technical crew 2,099 2,148 - 2.3
Cabin crew 7,586 7,733 - 1.9
Other ground sta 2,916 2,944 - 1.0
13,920 14,160 - 1.7
Location
Singapore 11,922 12,147 - 1.9
East Asia 856 846 + 1.2
Europe 420 407 + 3.2
South West Pacific 321 323 - 0.6
West Asia and Africa 254 281 - 9.6
Americas 147 156 - 5.8
13,920 14,160 - 1.7
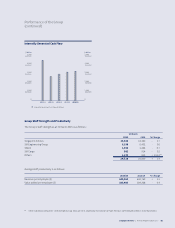
The Company’s average sta productivity ratios R10 are shown below:
2014/15 2013/14 % Change
Seat capacity per employee (seat-km) 8,547,066 8,462,275 + 1.0
Passenger load carried per employee (tonne-km) 625,516 625,995 - 0.1
Revenue per employee ($) 884,501 876,383 + 0.9
Value added per employee ($) 242,970 242,184 + 0.3
R10 The Company’s sta productivity ratios were computed based on average sta strength of 14,040 in 2014/15 (2013/14: 14,240).
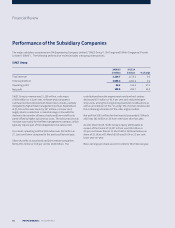
Performance of the Company
(continued)
Singapore Airlines | Annual Report FY2014/15 | 57