Singapore Airlines 2015 Annual Report Download - page 177
Download and view the complete annual report
Please find page 177 of the 2015 Singapore Airlines annual report below. You can navigate through the pages in the report by either clicking on the pages listed below, or by using the keyword search tool below to find specific information within the annual report.-
 1
1 -
2
-
3
-
4
-
5
-
6
-
7
-
8
-
9
-
10
-
11
-
12
-
13
-
14
-
15
-
16
-
17
-
18
-
19
-
20
-
21
-
22
-
23
-
24
-
25
-
26
-
27
-
28
-
29
-
30
-
31
-
32
-
33
-
34
-
35
-
36
-
37
-
38
-
39
-
40
-
41
-
42
-
43
-
44
-
45
-
46
-
47
-
48
-
49
-
50
-
51
-
52
-
53
-
54
-
55
-
56
-
57
-
58
-
59
-
60
-
61
-
62
-
63
-
64
-
65
-
66
-
67
-
68
-
69
-
70
-
71
-
72
-
73
-
74
-
75
-
76
-
77
-
78
-
79
-
80
-
81
-
82
-
83
-
84
-
85
-
86
-
87
-
88
-
89
-
90
-
91
-
92
-
93
-
94
-
95
-
96
-
97
-
98
-
99
-
100
-
101
-
102
-
103
-
104
-
105
-
106
-
107
-
108
-
109
-
110
-
111
-
112
-
113
-
114
-
115
-
116
-
117
-
118
-
119
-
120
-
121
-
122
-
123
-
124
-
125
-
126
-
127
-
128
-
129
-
130
-
131
-
132
-
133
-
134
-
135
-
136
-
137
-
138
-
139
-
140
-
141
-
142
-
143
-
144
-
145
-
146
-
147
-
148
-
149
-
150
-
151
-
152
-
153
-
154
-
155
-
156
-
157
-
158
-
159
-
160
-
161
-
162
-
163
-
164
-
165
-
166
-
 167
167 -
 168
168 -
 169
169 -
 170
170 -
 171
171 -
 172
172 -
 173
173 -
 174
174 -
 175
175 -
 176
176 -
 177
177 -
 178
178 -
 179
179 -
 180
180 -
 181
181 -
 182
182 -
 183
183 -
 184
184 -
 185
185 -
 186
186 -
 187
187 -
188
-
189
-
190
-
191
-
192
-
193
-
194
-
195
-
196
-
197
-
198
-
199
-
200
-
201
-
202
-
203
-
204
-
205
-
206
-
207
-
208
-
209
-
210
-
211
-
212
-
213
-
214
-
215
-
216
-
217
-
218
-
219
-
220
-
221
-
222
-
223
-
224
 |
 |

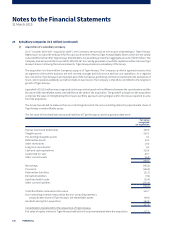
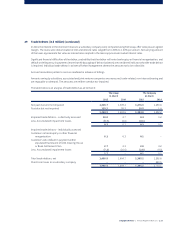
25 Joint Venture Companies (in $ million) (continued)
Aggregate information about the Group’s investment in the other joint venture companies that are not individually material is
as follows:
The Group’s share of the assets and liabilities comprises:
The Group
31 March
2015 2014
Assets and liabilities
Current assets 41.2 7.0
Non-current assets 10.3 10.1
51.5 17.1
Current liabilities (9.4) (5.2)
Non-current liabilities (0.3) (0.5)
41.8 11.4
The Group’s share of the results is as follows:
The Group
FY2014/15 FY2013/14
Results
(Loss)/Profit after tax (5.0) 7.5
Other comprehensive income (1.6) (0.2)
Total comprehensive income (6.6) 7.3
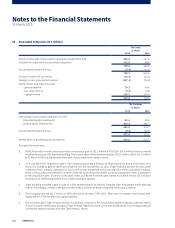
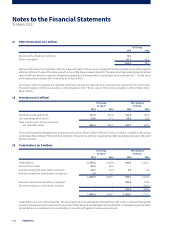
26 Long-Term Investments (in $ million)
The Group The Company
31 March 31 March
2015 2014 2015 2014
Available-for-sale investments
Quoted
Government securities 0.6 0.6 0.6 0.6
Equity investments – 315.3 – 315.3
Unquoted
Non-equity investments 303.6 293.6 303.6 293.6
Equity investments, at cost 116.4 108.1 28.0 28.0
Accumulated impairment loss (73.1) (9.2) (9.5) (9.2)
347.5 708.4 322.7 628.3
Held-to-maturity investments
Quoted non-equity investments 368.7 243.5 368.7 243.5
Unquoted non-equity investments 408.8 173.3 408.8 173.3
777.5 416.8 777.5 416.8
1,125.0 1,125.2 1,100.2 1,045.1
The Group’s non-equity investments comprise investments in corporate bonds, credit-linked notes, fixed-rate notes and
investment funds.
The interest rate for quoted government securities is 7.00% (FY2013/14: 7.00%) per annum. The interest rates for quoted and
unquoted non-equity investments range from 1.30% to 4.47% (FY2013/14: 2.37% to 4.65%) per annum and 2.57% to 5.31%
(FY2013/14: 2.55% to 4.02%) per annum respectively.
Singapore Airlines | Annual Report FY2014/15 |175