Singapore Airlines 2015 Annual Report Download - page 211
Download and view the complete annual report
Please find page 211 of the 2015 Singapore Airlines annual report below. You can navigate through the pages in the report by either clicking on the pages listed below, or by using the keyword search tool below to find specific information within the annual report.-
 1
1 -
2
-
3
-
4
-
5
-
6
-
7
-
8
-
9
-
10
-
11
-
12
-
13
-
14
-
15
-
16
-
17
-
18
-
19
-
20
-
21
-
22
-
23
-
24
-
25
-
26
-
27
-
28
-
29
-
30
-
31
-
32
-
33
-
34
-
35
-
36
-
37
-
38
-
39
-
40
-
41
-
42
-
43
-
44
-
45
-
46
-
47
-
48
-
49
-
50
-
51
-
52
-
53
-
54
-
55
-
56
-
57
-
58
-
59
-
60
-
61
-
62
-
63
-
64
-
65
-
66
-
67
-
68
-
69
-
70
-
71
-
72
-
73
-
74
-
75
-
76
-
77
-
78
-
79
-
80
-
81
-
82
-
83
-
84
-
85
-
86
-
87
-
88
-
89
-
90
-
91
-
92
-
93
-
94
-
95
-
96
-
97
-
98
-
99
-
100
-
101
-
102
-
103
-
104
-
105
-
106
-
107
-
108
-
109
-
110
-
111
-
112
-
113
-
114
-
115
-
116
-
117
-
118
-
119
-
120
-
121
-
122
-
123
-
124
-
125
-
126
-
127
-
128
-
129
-
130
-
131
-
132
-
133
-
134
-
135
-
136
-
137
-
138
-
139
-
140
-
141
-
142
-
143
-
144
-
145
-
146
-
147
-
148
-
149
-
150
-
151
-
152
-
153
-
154
-
155
-
156
-
157
-
158
-
159
-
160
-
161
-
162
-
163
-
164
-
165
-
166
-
167
-
168
-
169
-
170
-
171
-
172
-
173
-
174
-
175
-
176
-
177
-
178
-
179
-
180
-
181
-
182
-
183
-
184
-
185
-
186
-
187
-
188
-
189
-
190
-
191
-
192
-
193
-
194
-
195
-
196
-
197
-
198
-
199
-
200
-
 201
201 -
 202
202 -
 203
203 -
 204
204 -
 205
205 -
 206
206 -
 207
207 -
 208
208 -
 209
209 -
 210
210 -
 211
211 -
 212
212 -
 213
213 -
 214
214 -
 215
215 -
 216
216 -
 217
217 -
 218
218 -
 219
219 -
 220
220 -
 221
221 -
222
-
223
-
224
 |
 |

Ten-Year Statistical Record
2014/15 2013/14 2012/13 2011/12 2010/11 2009/10 2008/09 2007/08 2006/07 2005/06
Singapore Airlines
Financial
Total revenue ($ million) 12,418.4 12,479.7 12,387.0 12,070.1 11,739.1 10,145.0 13,049.5 12,759.6 11,343.9 10,302.8
Total expenditure ($ million) 12,078.2 12,224.1 12,199.8 11,889.5 10,887.8 10,183.6 12,226.6 11,115.6 10,316.9 9,651.8
Operating profit /(loss) ($ million) 340.2 255.6 187.2 180.6 851.3 (38.6) 822.9 1,644.0 1,027.0 651.0
Profit/(Loss) before taxation ($ million) 563.1 536.4 (682.4) 413.3 1,194.0 233.3 1,252.4 2,077.6 2,291.1 940.8
Profit/(Loss) after taxation ($ million) 540.3 538.5 (694.1) 390.2 1,011.2 279.8 1,218.7 1,758.8 2,213.2 746.0
Capital disbursements R1 ($ million) 1,788.5 2,251.1 1,648.2 1,762.7 981.9 1,372.4 1,698.6 1,814.4 2,792.7 1,458.6
Passenger – yield (cents/pkm) 11.2 11.1 11.4 11.8 11.9 10.4 12.5 12.1 10.9 10.6
– unit cost (cents/ask) 8.9 9.1 9.2 9.2 8.9 8.6 9.2 8.4 7.9 7.5
– breakeven load factor (%) 79.5 82.0 80.7 78.0 74.8 82.7 73.6 69.4 72.5 70.8
Operating passenger fleet
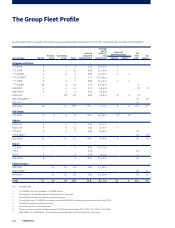
Aircraft (numbers) 105 103 101 100 108 108 103 98 94 90
Average age (months) 85 81 80 74 75 75 74 77 75 76
Industry-wide average age (months) 145 147 148 151 163 162 162 162 161 159
Passenger production
Destination cities (numbers) 60 62 63 63 64 68 66 65 64 62
Distance flown (million km) 384.4 392.2 386.3 374.6 354.1 342.4 379.8 365.9 353.1 341.8
Time flown (hours) 508,591 517,987 507,562 490,261 460,096 443,141 492,103 474,432 458,936 441,510
Available seat-km (million) 120,000.8 120,502.8 118,264.4 113,409.7 108,060.2 105,673.7 117,788.7 113,919.1 112,543.8 109,483.7
Traffic
Passengers carried (‘000) 18,737 18,628 18,210 17,155 16,647 16,480 18,293 19,120 18,346 16,995
Revenue passenger-km (million) 94,209.2 95,064.3 93,765.6 87,824.0 84,801.3 82,882.5 90,128.1 91,485.2 89,148.8 82,741.7
Passenger load factor (%) 78.5 78.9 79.3 77.4 78.5 78.4 76.5 80.3 79.2 75.6
Staff
Average strength (numbers) 14,040 14,240 14,156 13,893 13,588 13,934 14,343 14,071 13,847 13,729
Seat capacity per employee R2 (seat-km) 8,547,066 8,462,275 8,354,366 8,163,082 7,952,620 7,583,874 8,212,278 8,096,020 8,127,667 7,974,630
Passenger load carried
per employee R3 (tonne-km) 625,516 625,995 619,969 594,663 588,714 563,318 598,047 618,295 613,211 577,784
Revenue per employee ($) 884,501 876,383 875,035 868,790 863,931 728,075 909,817 906,801 819,232 750,441
Value added per employee ($) 242,970 242,184 159,593 237,472 310,480 219,678 294,666 368,382 368,831 258,810
SilkAir
Passengers carried (‘000) 3,553 3,411 3,295 3,032 2,764 2,356 1,954 1,815 1,616 1,259
Revenue passenger-km (million) 5,864.9 5,516.1 5,223.1 4,469.4 4,039.6 3,466.4 3,158.6 3,094.9 2,712.9 2,208.0
Available seat-km (million) 8,355.2 7,926.9 7,096.3 5,904.8 5,285.1 4,495.9 4,355.2 4,323.0 3,865.8 3,295.3
Passenger load factor (%) 70.2 69.6 73.6 75.7 76.4 77.1 72.5 71.6 70.2 67.0
Passenger yield (cents/pkm) 13.9 13.7 14.1 14.5 14.1 13.1 15.0 14.0 13.4 13.3
Passenger unit cost (cents/ask) 9.7 9.8 9.9 10.1 9.4 9.9 10.9 9.7 9.4 8.9
Passenger breakeven load factor (%) 69.8 71.5 70.2 69.7 66.7 75.6 72.7 69.3 70.1 66.9
SIA Cargo
Cargo and mail carried (million kg) 1,124.0 1,117.8 1,144.6 1,205.8 1,156.4 1,122.4 1,219.5 1,308.0 1,284.9 1,248.5
Cargo load (million tonne-km) 6,347.2 6,419.3 6,763.6 7,198.2 7,174.0 6,659.1 7,299.3 7,959.2 7,995.6 7,874.4
Gross capacity (million tonne-km) 10,024.9 10,273.6 10,661.0 11,286.5 11,208.5 10,510.1 12,292.5 12,787.8 12,889.8 12,378.9
Cargo load factor (%) 63.3 62.5 63.4 63.8 64.0 63.4 59.4 62.2 62.0 63.6
Cargo yield (cents/ltk) 32.8 32.7 33.4 34.9 36.2 32.0 38.2 38.7 38.4 38.6
Cargo unit cost (cents/ctk) 21.4 21.9 23.2 23.5 22.3 21.9 24.9 23.4 24.5 23.5
Cargo breakeven load factor (%) 65.2 67.0 69.5 67.3 61.6 68.4 65.2 60.5 63.8 60.9
Singapore Airlines, Silkair And SIA Cargo
Overall load (million tonne-km) 15,557.4 15,778.1 16,047.3 15,898.8 15,576.3 14,853.6 16,196.8 16,973.8 16,765.6 16,036.8
Overall capacity (million tonne-km) 22,607.8 22,889.7 23,188.4 23,378.6 22,515.1 21,495.9 24,468.5 24,572.6 24,474.8 23,605.5
Overall load factor (%) 68.8 68.9 69.2 68.0 69.2 69.1 66.2 69.1 68.5 67.9
Overall yield (cents/ltk) 86.1 84.9 85.3 85.5 85.5 76.1 89.8 86.0 78.4 75.4
Overall unit cost (cents/ctk) 60.4 60.8 60.4 58.6 55.4 54.6 58.4 52.9 50.6 48.2
Overall breakeven load factor (%) 70.2 71.6 70.8 68.5 64.8 71.7 65.0 61.5 64.5 63.9
R1 Capital disbursements comprised capital expenditure in property, plant and equipment, intangible assets, investments in subsidiary, associated companies and joint venture
companies, and additional long-term equity investments.
R2 Seat capacity per employee is available seat capacity divided by Singapore Airlines’ average sta strength.
R3 Passenger load carried per employee is defined as passenger load and excess baggage carried divided by Singapore Airlines’ average sta strength.
Singapore Airlines | Annual Report FY2014/15 |209