Singapore Airlines 2015 Annual Report Download - page 192
Download and view the complete annual report
Please find page 192 of the 2015 Singapore Airlines annual report below. You can navigate through the pages in the report by either clicking on the pages listed below, or by using the keyword search tool below to find specific information within the annual report.-
 1
1 -
2
-
3
-
4
-
5
-
6
-
7
-
8
-
9
-
10
-
11
-
12
-
13
-
14
-
15
-
16
-
17
-
18
-
19
-
20
-
21
-
22
-
23
-
24
-
25
-
26
-
27
-
28
-
29
-
30
-
31
-
32
-
33
-
34
-
35
-
36
-
37
-
38
-
39
-
40
-
41
-
42
-
43
-
44
-
45
-
46
-
47
-
48
-
49
-
50
-
51
-
52
-
53
-
54
-
55
-
56
-
57
-
58
-
59
-
60
-
61
-
62
-
63
-
64
-
65
-
66
-
67
-
68
-
69
-
70
-
71
-
72
-
73
-
74
-
75
-
76
-
77
-
78
-
79
-
80
-
81
-
82
-
83
-
84
-
85
-
86
-
87
-
88
-
89
-
90
-
91
-
92
-
93
-
94
-
95
-
96
-
97
-
98
-
99
-
100
-
101
-
102
-
103
-
104
-
105
-
106
-
107
-
108
-
109
-
110
-
111
-
112
-
113
-
114
-
115
-
116
-
117
-
118
-
119
-
120
-
121
-
122
-
123
-
124
-
125
-
126
-
127
-
128
-
129
-
130
-
131
-
132
-
133
-
134
-
135
-
136
-
137
-
138
-
139
-
140
-
141
-
142
-
143
-
144
-
145
-
146
-
147
-
148
-
149
-
150
-
151
-
152
-
153
-
154
-
155
-
156
-
157
-
158
-
159
-
160
-
161
-
162
-
163
-
164
-
165
-
166
-
167
-
168
-
169
-
170
-
171
-
172
-
173
-
174
-
175
-
176
-
177
-
178
-
179
-
180
-
181
-
 182
182 -
 183
183 -
 184
184 -
 185
185 -
 186
186 -
 187
187 -
 188
188 -
 189
189 -
 190
190 -
 191
191 -
 192
192 -
 193
193 -
 194
194 -
 195
195 -
 196
196 -
 197
197 -
 198
198 -
 199
199 -
 200
200 -
 201
201 -
 202
202 -
203
-
204
-
205
-
206
-
207
-
208
-
209
-
210
-
211
-
212
-
213
-
214
-
215
-
216
-
217
-
218
-
219
-
220
-
221
-
222
-
223
-
224
 |
 |

Notes to the Financial Statements
31 March 2015
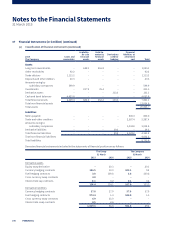
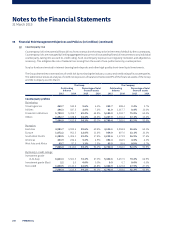
37 Financial Instruments (in $ million) (continued)
(a) Classification of financial instruments (continued)
2014
The Company
Loans and
receivables
Available-
for-sale
financial
assets
Held-to-
maturity
financial
assets
Derivatives
used for
hedging
Financial
liabilities at
amortised
cost Total
Assets
Long-term investments – 628.3 416.8 – – 1,045.1
Other receivables 92.2 – – – – 92.2
Trade debtors 1,113.2 – – – – 1,113.2
Deposits and other debtors 20.3 – – – – 20.3
Amounts owing by
subsidiary companies 599.9 – – – – 599.9
Investments – 197.9 35.4 – – 233.3
Derivative assets – – – 133.3 – 133.3
Cash and bank balances 4,623.8 – – – – 4,623.8
Total financial assets 6,449.4 826.2 452.2 133.3 – 7,861.1
Total non-financial assets 13,004.6
Total assets 20,865.7
Liabilities
Notes payable – – – – 800.0 800.0
Trade and other creditors – – – – 2,287.4 2,287.4
Amounts owing to
subsidiary companies – – – – 1,034.8 1,034.8
Derivative liabilities – – – 29.2 – 29.2
Total financial liabilities – – – 29.2 4,122.2 4,151.4
Total non-financial liabilities 4,602.2
Total liabilities 8,753.6
Derivative financial instruments included in the statements of financial position are as follows:
The Group The Company
31 March 31 March
2015 2014 2015 2014
Derivative assets
Equity swap derivative – 20.3 – 20.3
Currency hedging contracts 106.5 10.0 103.1 9.2
Fuel hedging contracts 3.8 100.6 3.8 100.6
Cross currency swap contracts 4.0 – – –
Interest rate cap contracts 0.1 3.2 0.1 3.2
114.4 134.1 107.0 133.3
Derivative liabilities
Currency hedging contracts 37.8 27.9 37.8 27.9
Fuel hedging contracts 974.4 1.3 944.0 1.3
Cross currency swap contracts 6.9 25.0 – –
Interest rate swap contracts 0.5 2.6 – –
1,019.6 56.8 981.8 29.2
190 FINANCIAL