Singapore Airlines 2015 Annual Report Download - page 55
Download and view the complete annual report
Please find page 55 of the 2015 Singapore Airlines annual report below. You can navigate through the pages in the report by either clicking on the pages listed below, or by using the keyword search tool below to find specific information within the annual report.-
 1
1 -
2
-
3
-
4
-
5
-
6
-
7
-
8
-
9
-
10
-
11
-
12
-
13
-
14
-
15
-
16
-
17
-
18
-
19
-
20
-
21
-
22
-
23
-
24
-
25
-
26
-
27
-
28
-
29
-
30
-
31
-
32
-
33
-
34
-
35
-
36
-
37
-
38
-
39
-
40
-
41
-
42
-
43
-
44
-
 45
45 -
 46
46 -
 47
47 -
 48
48 -
 49
49 -
 50
50 -
 51
51 -
 52
52 -
 53
53 -
 54
54 -
 55
55 -
 56
56 -
 57
57 -
 58
58 -
 59
59 -
 60
60 -
 61
61 -
 62
62 -
 63
63 -
 64
64 -
 65
65 -
66
-
67
-
68
-
69
-
70
-
71
-
72
-
73
-
74
-
75
-
76
-
77
-
78
-
79
-
80
-
81
-
82
-
83
-
84
-
85
-
86
-
87
-
88
-
89
-
90
-
91
-
92
-
93
-
94
-
95
-
96
-
97
-
98
-
99
-
100
-
101
-
102
-
103
-
104
-
105
-
106
-
107
-
108
-
109
-
110
-
111
-
112
-
113
-
114
-
115
-
116
-
117
-
118
-
119
-
120
-
121
-
122
-
123
-
124
-
125
-
126
-
127
-
128
-
129
-
130
-
131
-
132
-
133
-
134
-
135
-
136
-
137
-
138
-
139
-
140
-
141
-
142
-
143
-
144
-
145
-
146
-
147
-
148
-
149
-
150
-
151
-
152
-
153
-
154
-
155
-
156
-
157
-
158
-
159
-
160
-
161
-
162
-
163
-
164
-
165
-
166
-
167
-
168
-
169
-
170
-
171
-
172
-
173
-
174
-
175
-
176
-
177
-
178
-
179
-
180
-
181
-
182
-
183
-
184
-
185
-
186
-
187
-
188
-
189
-
190
-
191
-
192
-
193
-
194
-
195
-
196
-
197
-
198
-
199
-
200
-
201
-
202
-
203
-
204
-
205
-
206
-
207
-
208
-
209
-
210
-
211
-
212
-
213
-
214
-
215
-
216
-
217
-
218
-
219
-
220
-
221
-
222
-
223
-
224
 |
 |
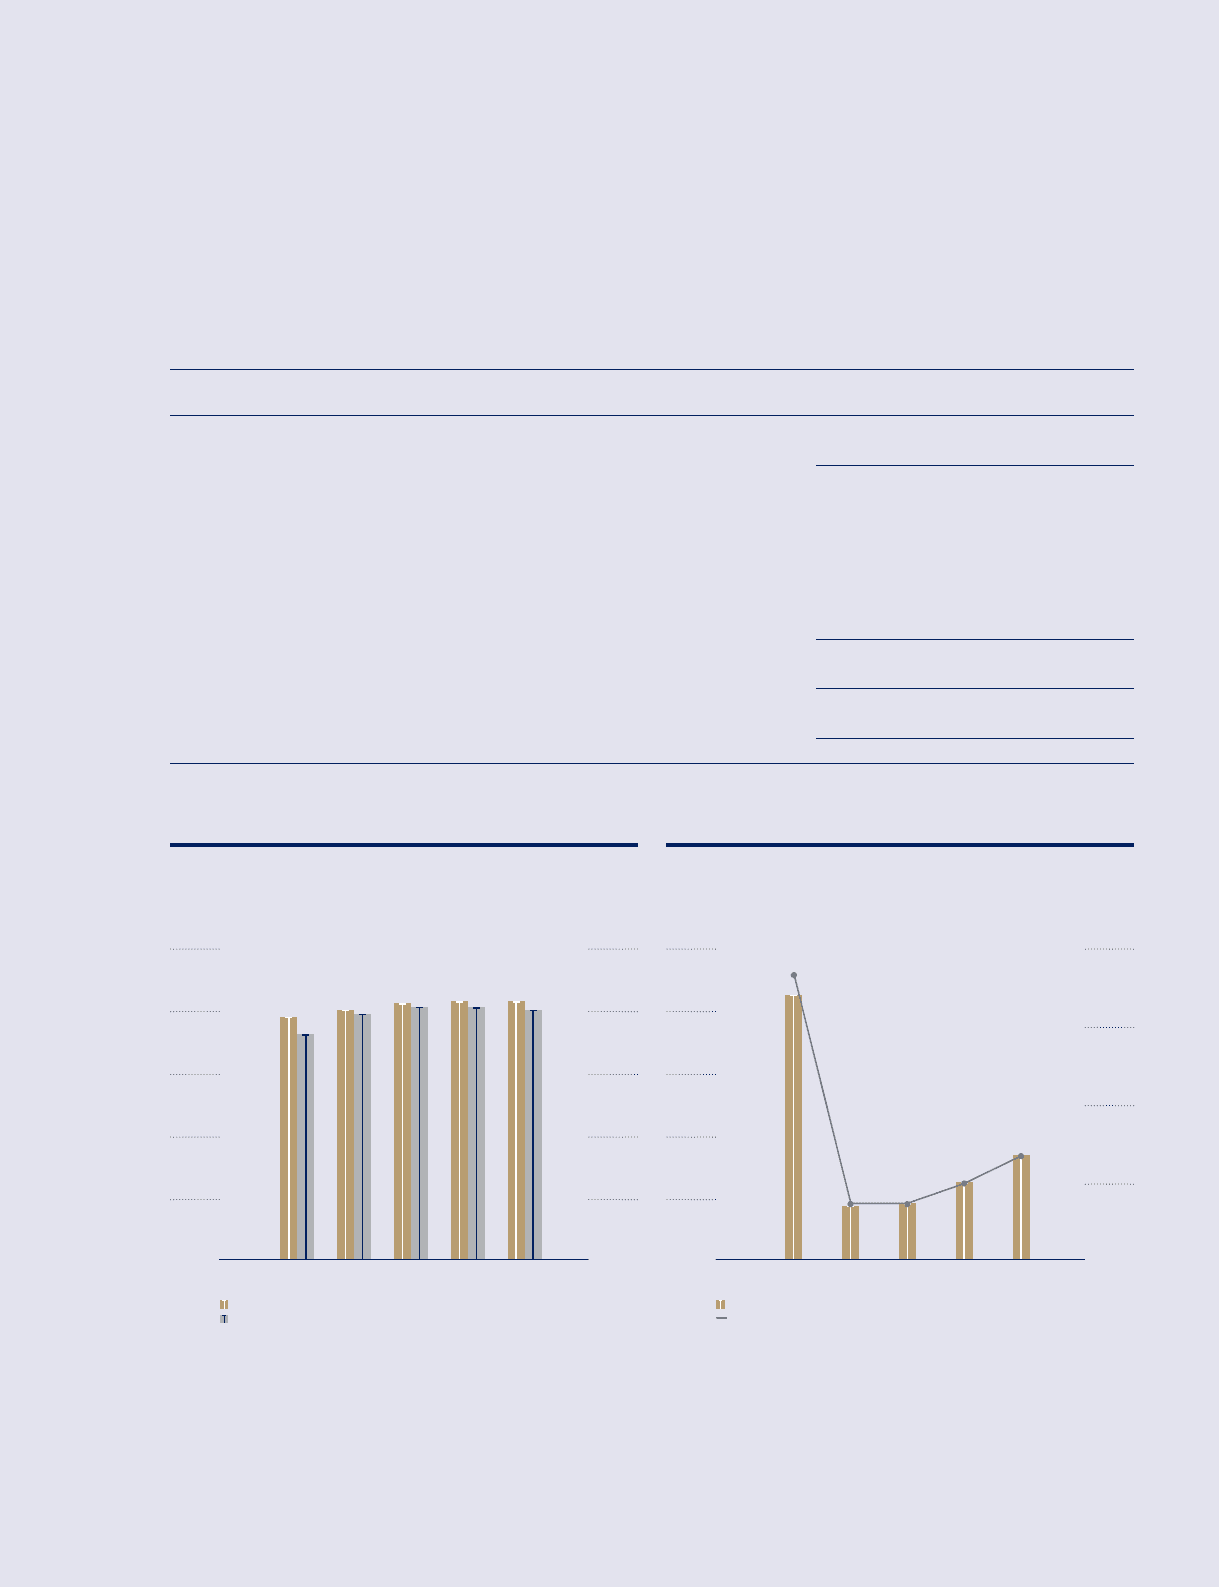
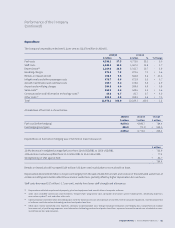
Operating Performance (continued)
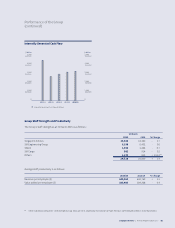
Company Revenue and Expenditure
2010/11 2011/12 2012/13 2013/14 2014/15
Revenue ($ Million)
Expenditure ($ Million)
15,000
12,000
9,000
6,000
3,000
0
15,000
12,000
9,000
6,000
3,000
0
$ Million $ Million
Operating Profit and Operating Profit Margin
2010/11 2011/12 2012/13 2013/14 2014/15
Operating Profit ($ Million)
Operating Profit Margin (%)
1,000
800
600
400
200
0
8
6
4
2
0
$ Million Per Cent
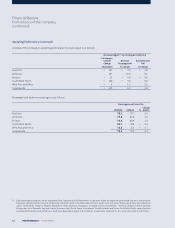
Earnings
2014/15 2013/14
$ million $ million % Change
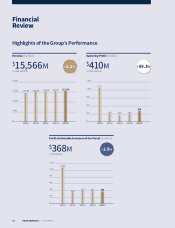
Revenue 12,418.4 12,479.7 - 0.5
Expenditure 12,078.2 12,224.1 - 1.2
Operating profit 340.2 255.6 + 33.1
Finance charges (44.0) (33.6) - 31.0
Interest income 79.3 64.3 + 23.3
Surplus on disposal of aircra, spares and spare engines 36.8 45.6 - 19.3
Dividends from subsidiary and associated companies 215.2 211.5 + 1.7
Dividends from long-term investments 4.9 5.4 - 9.3
Other non-operating items (65.2) (52.7) - 23.7
Profit before exceptional items 567.2 496.1 + 14.3
Exceptional items R4 (4.1) 40.3 n.m.
Profit before taxation 563.1 536.4 + 5.0
Taxation (22.8) 2.1 n.m.
Profit aer taxation 540.3 538.5 + 0.3
n.m. not meaningful
R4 The exceptional items in 2014/15 pertained to provision for settlement with plaintis in the Transpacific Class Action ($11.4 million), partly oset by
additional gain on sale of Virgin Atlantic Limited (“VAL”) ($7.3 million). Last year’s exceptional item pertained to gain on sale of the Company’s 49 per cent
equity stake in VAL.
Performance of the Company
(continued)
Singapore Airlines | Annual Report FY2014/15 | 53