Singapore Airlines 2015 Annual Report Download - page 48
Download and view the complete annual report
Please find page 48 of the 2015 Singapore Airlines annual report below. You can navigate through the pages in the report by either clicking on the pages listed below, or by using the keyword search tool below to find specific information within the annual report.-
 1
1 -
2
-
3
-
4
-
5
-
6
-
7
-
8
-
9
-
10
-
11
-
12
-
13
-
14
-
15
-
16
-
17
-
18
-
19
-
20
-
21
-
22
-
23
-
24
-
25
-
26
-
27
-
28
-
29
-
30
-
31
-
32
-
33
-
34
-
35
-
36
-
37
-
 38
38 -
 39
39 -
 40
40 -
 41
41 -
 42
42 -
 43
43 -
 44
44 -
 45
45 -
 46
46 -
 47
47 -
 48
48 -
 49
49 -
 50
50 -
 51
51 -
 52
52 -
 53
53 -
 54
54 -
 55
55 -
 56
56 -
 57
57 -
 58
58 -
59
-
60
-
61
-
62
-
63
-
64
-
65
-
66
-
67
-
68
-
69
-
70
-
71
-
72
-
73
-
74
-
75
-
76
-
77
-
78
-
79
-
80
-
81
-
82
-
83
-
84
-
85
-
86
-
87
-
88
-
89
-
90
-
91
-
92
-
93
-
94
-
95
-
96
-
97
-
98
-
99
-
100
-
101
-
102
-
103
-
104
-
105
-
106
-
107
-
108
-
109
-
110
-
111
-
112
-
113
-
114
-
115
-
116
-
117
-
118
-
119
-
120
-
121
-
122
-
123
-
124
-
125
-
126
-
127
-
128
-
129
-
130
-
131
-
132
-
133
-
134
-
135
-
136
-
137
-
138
-
139
-
140
-
141
-
142
-
143
-
144
-
145
-
146
-
147
-
148
-
149
-
150
-
151
-
152
-
153
-
154
-
155
-
156
-
157
-
158
-
159
-
160
-
161
-
162
-
163
-
164
-
165
-
166
-
167
-
168
-
169
-
170
-
171
-
172
-
173
-
174
-
175
-
176
-
177
-
178
-
179
-
180
-
181
-
182
-
183
-
184
-
185
-
186
-
187
-
188
-
189
-
190
-
191
-
192
-
193
-
194
-
195
-
196
-
197
-
198
-
199
-
200
-
201
-
202
-
203
-
204
-
205
-
206
-
207
-
208
-
209
-
210
-
211
-
212
-
213
-
214
-
215
-
216
-
217
-
218
-
219
-
220
-
221
-
222
-
223
-
224
 |
 |
Financial Review
Performance of the Group
(continued)
Group Earnings (continued)
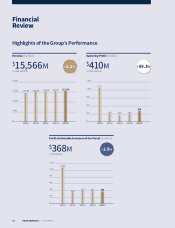
Excluding Tiger Airways, Group expenditure decreased by
$195 million (-1.3 per cent) year-on-year to $14,790 million,
primarily from a $263 million reduction in net fuel cost. Before
hedging, fuel cost declined $899 million, with the average jet
fuel price sliding 15.4 per cent from a year earlier and a 1.6 per
cent fall in volume uplied, partially oset by the stronger US
Dollar against the Singapore Dollar, and a $549 million hedging
loss compared to the hedging gain of $87 million last year.
Non-fuel costs increased $68 million, primarily due to higher
lease rentals with more aircra on lease, alleviated by lower
depreciation and sta costs.
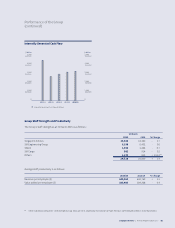
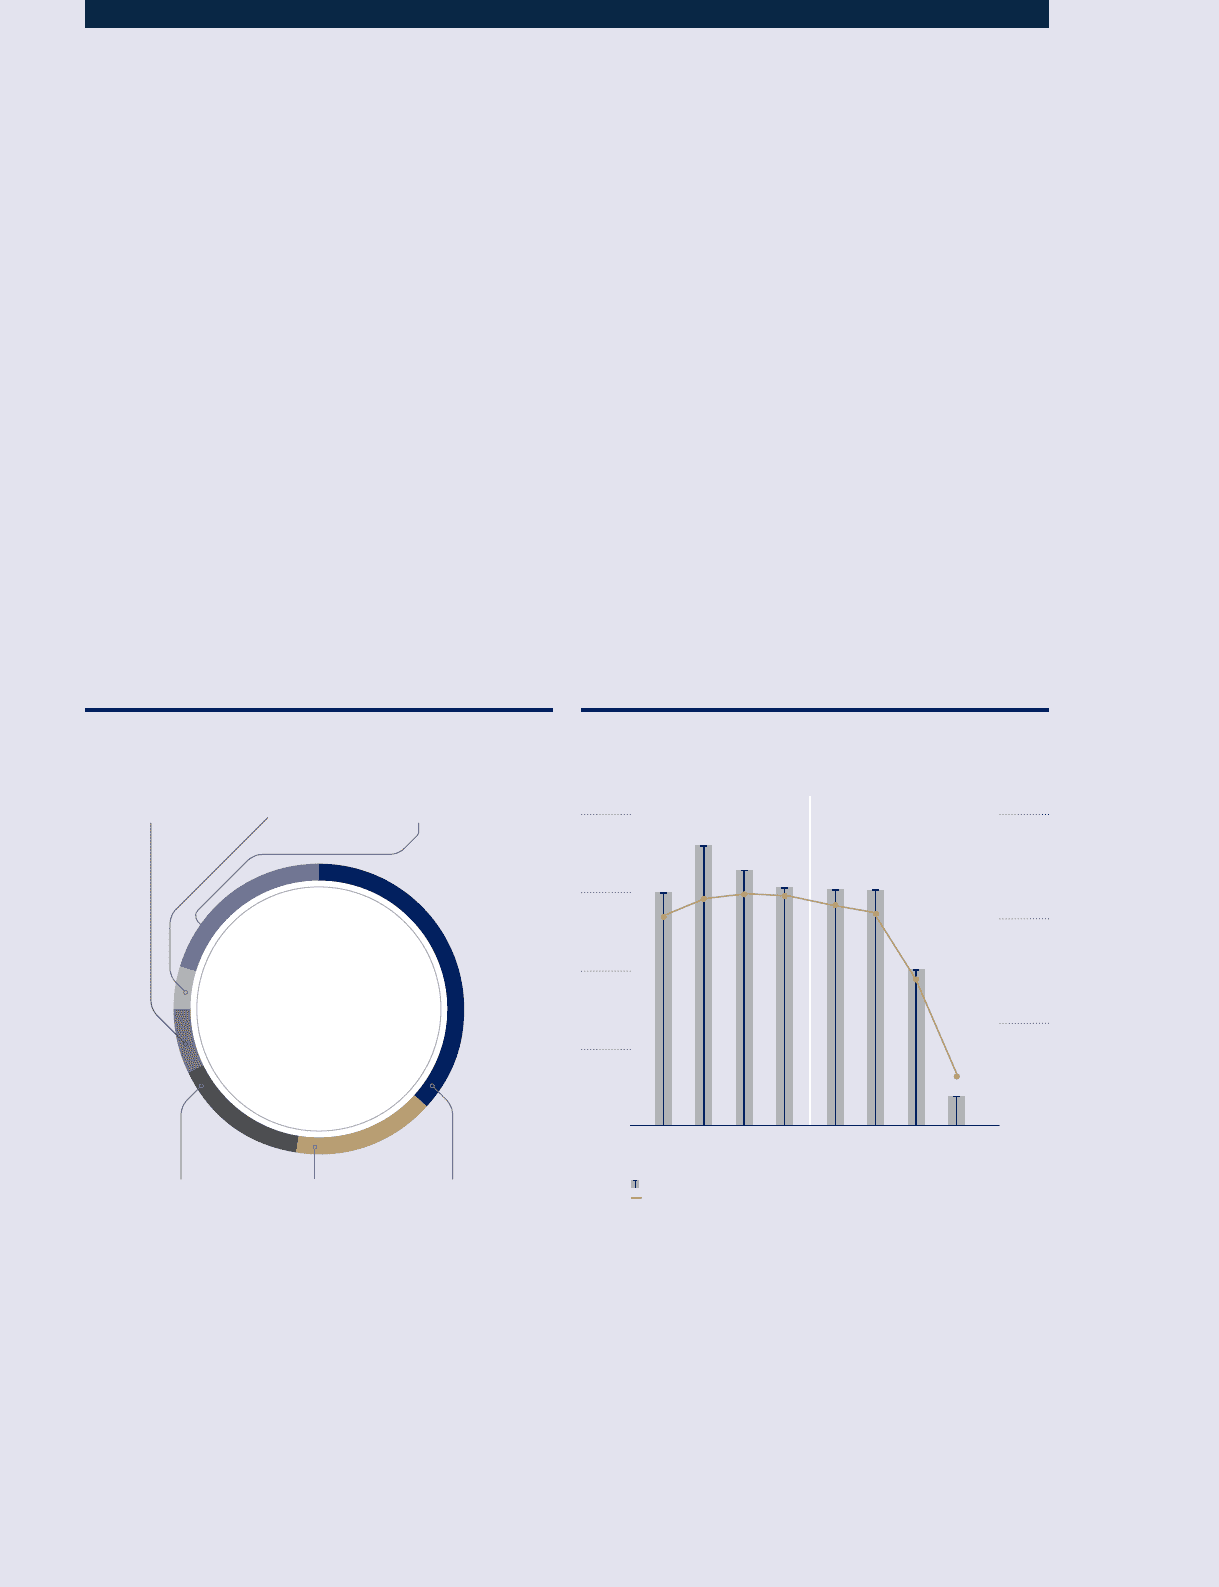
Group Expenditure
(excluding Tiger Airways)
Fuel Costs
Aer Hedging
Depreciation &
Lease Rentals
Sta Costs
Handling Charges Passenger Costs Others
36.8%
20.1%
15.7%
4.9%
15.5%
7.0%
GROUP
EXPENDITURE
-1.3%
to $14,790 million
Consequently, the Group’s operating profit excluding
Tiger Airways improved $160 million to $419 million for the
financial year ended 31 March 2015. Except for SIA Engineering
Company (“SIAEC Group”), operating performance for
all the major companies in the Group improved from the
preceding year. Singapore Airlines (“the Company”) recorded
an operating profit of $340 million in the financial year, an
improvement of $84 million from a year ago. SIAEC Group’s
operating profit was $32 million lower, as the reduction
in revenue (-$59 million) outstripped the reduction in
expenditure (-$27 million). SIA Cargo narrowed its full
year operating loss by $78 million to $22 million, largely
attributable to its capacity rationalisation eort in response to
excess capacity in the air cargo market. Please refer to the review
of the Company and subsidiary companies for further details.
Quarterly Trend of Group Fuel Price and Fuel Cost
(excluding hedging and Tiger Airways)
2013/14
Q1 Q2 Q3 Q4
2014/15
Q1 Q2 Q3 Q4
Fuel Cost (excluding hedging)
Fuel Price before hedging (USD/BBL)
1,600
1,400
1,200
1,000
800
150
120
90
60
$ Million USD/BBL
46 PERFORMANCE | Financial Review |