Singapore Airlines 2015 Annual Report Download - page 141
Download and view the complete annual report
Please find page 141 of the 2015 Singapore Airlines annual report below. You can navigate through the pages in the report by either clicking on the pages listed below, or by using the keyword search tool below to find specific information within the annual report.-
 1
1 -
2
-
3
-
4
-
5
-
6
-
7
-
8
-
9
-
10
-
11
-
12
-
13
-
14
-
15
-
16
-
17
-
18
-
19
-
20
-
21
-
22
-
23
-
24
-
25
-
26
-
27
-
28
-
29
-
30
-
31
-
32
-
33
-
34
-
35
-
36
-
37
-
38
-
39
-
40
-
41
-
42
-
43
-
44
-
45
-
46
-
47
-
48
-
49
-
50
-
51
-
52
-
53
-
54
-
55
-
56
-
57
-
58
-
59
-
60
-
61
-
62
-
63
-
64
-
65
-
66
-
67
-
68
-
69
-
70
-
71
-
72
-
73
-
74
-
75
-
76
-
77
-
78
-
79
-
80
-
81
-
82
-
83
-
84
-
85
-
86
-
87
-
88
-
89
-
90
-
91
-
92
-
93
-
94
-
95
-
96
-
97
-
98
-
99
-
100
-
101
-
102
-
103
-
104
-
105
-
106
-
107
-
108
-
109
-
110
-
111
-
112
-
113
-
114
-
115
-
116
-
117
-
118
-
119
-
120
-
121
-
122
-
123
-
124
-
125
-
126
-
127
-
128
-
129
-
130
-
 131
131 -
 132
132 -
 133
133 -
 134
134 -
 135
135 -
 136
136 -
 137
137 -
 138
138 -
 139
139 -
 140
140 -
 141
141 -
 142
142 -
 143
143 -
 144
144 -
 145
145 -
 146
146 -
 147
147 -
 148
148 -
 149
149 -
 150
150 -
 151
151 -
152
-
153
-
154
-
155
-
156
-
157
-
158
-
159
-
160
-
161
-
162
-
163
-
164
-
165
-
166
-
167
-
168
-
169
-
170
-
171
-
172
-
173
-
174
-
175
-
176
-
177
-
178
-
179
-
180
-
181
-
182
-
183
-
184
-
185
-
186
-
187
-
188
-
189
-
190
-
191
-
192
-
193
-
194
-
195
-
196
-
197
-
198
-
199
-
200
-
201
-
202
-
203
-
204
-
205
-
206
-
207
-
208
-
209
-
210
-
211
-
212
-
213
-
214
-
215
-
216
-
217
-
218
-
219
-
220
-
221
-
222
-
223
-
224
 |
 |

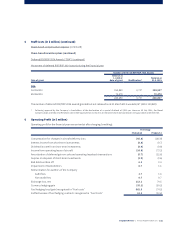
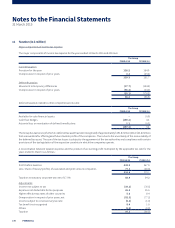
5 Sta Costs (in $ million) (continued)
Share-based compensation expense (continued)
Share-based incentive plans (continued)
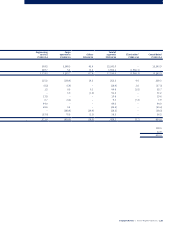
Number of Performance Shares
Date of grant
Balance at
1.4.2014/
date of grant Adjustment#Modification^ Vested
Balance at
31.3.2015
PSP
01.07.2011 145,526 (109,116) – (36,410) –
10.07.2012 169,213 – 4,192 – 173,405
15.07.2013 222,900 – 5,525 – 228,425
03.07.2014 242,559 – 6,009 – 248,568
780,198 (109,116) 15,726 (36,410) 650,398
#
Adjustment at the end of three-year performance period upon meeting performance targets and adjustment for number of days in service for retirees.
^ Following approval by the Company’s shareholders of the declaration of a special dividend of $0.25 per share on 30 July 2014, the Board
Compensation and Industrial Relations Committee approved an increase in all performance shares outstanding on 14 August 2014 under the PSP.
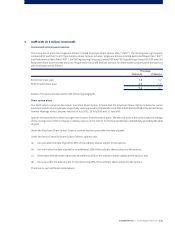
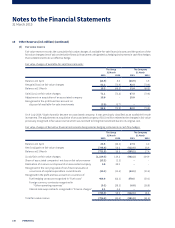
Fair value of share awards granted
The fair value of services received in return for shares awarded is measured by reference to the fair value of shares granted each
year under the RSP/RSP2014 and PSP/PSP 2014. The estimate of the fair value of the services received is measured based on
a Monte Carlo simulation model, which involves projection of future outcomes using statistical distributions of key random
variables including share price and volatility of returns.
The following table lists the key inputs to the model used for the July 2014 and July 2013 awards:
July 2014 Award July 2013 Award
RSP PSP RSP PSP
Expected dividend yield (%) Management’s forecast in line with dividend policy
Expected volatility (%) 12.10 – 18.61 18.61 19.35 – 21.01 19.35
Risk-free interest rate (%) 0.34 – 0.82 0.50 0.19 – 0.72 0.35
Expected term (years) 2.0 – 4.0 3.0 2.0 – 4.0 3.0
Share price at date of grant ($) 10.40 10.40 10.26 10.26
For non-market conditions, achievement factors are determined based on inputs from the Board Compensation & Industrial
Relations Committee for the purpose of accrual for the RSP until the achievement of the targets can be accurately ascertained.
Based on the Monte Carlo simulation model, the estimated fair value at date of grant for each share granted under the RSP
ranges from $8.95 to $9.68 (2014: $8.67 to $9.45) and the estimated fair value at date of grant for each share granted under the
PSP is $9.38 (2014: $7.82).
When estimating the fair value of the compensation cost, market-based performance conditions shall be taken into account.
Therefore, for performance share grants with market-based performance conditions, the compensation cost shall be charged
to the profit and loss account on a basis that fairly reflects the manner in which the benefits will accrue to the employee under
the plan over the remaining service period from date of grant to which the performance period relates, irrespective of whether
this performance condition is satisfied.
For performance share grants with non-market conditions, the Group revises its estimates of the number of share grants expected
to vest and corresponding adjustments are made to the profit and loss account and share-based compensation reserve.
Singapore Airlines | Annual Report FY2014/15 |139