Singapore Airlines 2015 Annual Report Download - page 50
Download and view the complete annual report
Please find page 50 of the 2015 Singapore Airlines annual report below. You can navigate through the pages in the report by either clicking on the pages listed below, or by using the keyword search tool below to find specific information within the annual report.-
 1
1 -
 2
2 -
 3
3 -
 4
4 -
 5
5 -
 6
6 -
 7
7 -
 8
8 -
 9
9 -
 10
10 -
 11
11 -
 12
12 -
 13
13 -
 14
14 -
 15
15 -
 16
16 -
 17
17 -
 18
18 -
 19
19 -
 20
20 -
 21
21 -
 22
22 -
 23
23 -
 24
24 -
 25
25 -
 26
26 -
 27
27 -
 28
28 -
 29
29 -
 30
30 -
 31
31 -
 32
32 -
 33
33 -
 34
34 -
 35
35 -
 36
36 -
 37
37 -
 38
38 -
 39
39 -
 40
40 -
 41
41 -
 42
42 -
 43
43 -
 44
44 -
 45
45 -
 46
46 -
 47
47 -
 48
48 -
 49
49 -
 50
50 -
 51
51 -
 52
52 -
 53
53 -
 54
54 -
 55
55 -
 56
56 -
 57
57 -
 58
58 -
 59
59 -
 60
60 -
 61
61 -
 62
62 -
 63
63 -
 64
64 -
 65
65 -
 66
66 -
 67
67 -
 68
68 -
 69
69 -
 70
70 -
 71
71 -
 72
72 -
 73
73 -
 74
74 -
 75
75 -
 76
76 -
 77
77 -
 78
78 -
 79
79 -
 80
80 -
 81
81 -
 82
82 -
 83
83 -
 84
84 -
 85
85 -
 86
86 -
 87
87 -
 88
88 -
 89
89 -
 90
90 -
 91
91 -
 92
92 -
 93
93 -
 94
94 -
 95
95 -
 96
96 -
 97
97 -
 98
98 -
 99
99 -
 100
100 -
 101
101 -
 102
102 -
 103
103 -
 104
104 -
 105
105 -
 106
106 -
 107
107 -
 108
108 -
 109
109 -
 110
110 -
 111
111 -
 112
112 -
 113
113 -
 114
114 -
 115
115 -
 116
116 -
 117
117 -
 118
118 -
 119
119 -
 120
120 -
 121
121 -
 122
122 -
 123
123 -
 124
124 -
 125
125 -
 126
126 -
 127
127 -
 128
128 -
 129
129 -
 130
130 -
 131
131 -
 132
132 -
 133
133 -
 134
134 -
 135
135 -
 136
136 -
 137
137 -
 138
138 -
 139
139 -
 140
140 -
 141
141 -
 142
142 -
 143
143 -
 144
144 -
 145
145 -
 146
146 -
 147
147 -
 148
148 -
 149
149 -
 150
150 -
 151
151 -
 152
152 -
 153
153 -
 154
154 -
 155
155 -
 156
156 -
 157
157 -
 158
158 -
 159
159 -
 160
160 -
 161
161 -
 162
162 -
 163
163 -
 164
164 -
 165
165 -
 166
166 -
 167
167 -
 168
168 -
 169
169 -
 170
170 -
 171
171 -
 172
172 -
 173
173 -
 174
174 -
 175
175 -
 176
176 -
 177
177 -
 178
178 -
 179
179 -
 180
180 -
 181
181 -
 182
182 -
 183
183 -
 184
184 -
 185
185 -
 186
186 -
 187
187 -
 188
188 -
 189
189 -
 190
190 -
 191
191 -
 192
192 -
 193
193 -
 194
194 -
 195
195 -
 196
196 -
 197
197 -
 198
198 -
 199
199 -
 200
200 -
 201
201 -
 202
202 -
 203
203 -
 204
204 -
 205
205 -
 206
206 -
 207
207 -
 208
208 -
 209
209 -
 210
210 -
 211
211 -
 212
212 -
 213
213 -
 214
214 -
 215
215 -
 216
216 -
 217
217 -
 218
218 -
 219
219 -
 220
220 -
 221
221 -
 222
222 -
 223
223 -
 224
224
 |
 |

Financial Review
Performance of the Group
(continued)
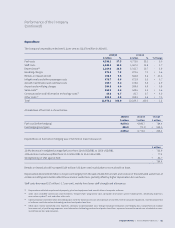
Dividends
For the financial year ended 31 March 2015, the Board
recommends a final dividend of 17 cents per share. Including
the interim dividend of 5 cents per share paid on 27 November
2014, the total dividend for the 2014/15 financial year will be
22 cents per share. This amounts to a payout of approximately
$257 million based on the number of issued shares as at
31 March 2015. The total ordinary dividend per share of 22 cents
translates to a payout ratio of 69.9 per cent, an increase of
1.2 percentage points compared to the 2013/14 payout ratio
of 68.7 per cent.
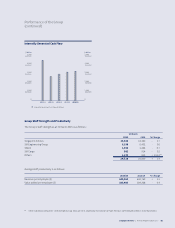
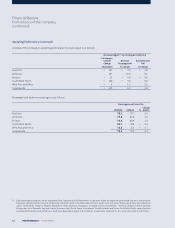
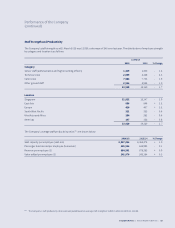
Capital Expenditure and Cash Flow of the Group
Capital expenditure was $2,600 million, 1.0 per cent higher than
last year. About 98 per cent of the capital spending was on
aircra, spares and spare engines. Internally generated cash
flow of $3,306 million (+2.6 per cent) was 1.27 times of capital
expenditure. The increase in internally generated cash flow was
primarily from operations, supplemented by higher proceeds
from disposal of aircra, spares and spare engines, partially
oset by lower dividends received from associated and joint
venture companies.
Group Capital Expenditure
2010/11 2011/12 2012/13 2013/14 2014/15
Other Capital Expenditure ($ Million)
Capital Expenditure on Aircra, Spares and Spare Engine ($ Million)
Cash Flow: Capital Expenditure Ratio (Times)
3,000
2,500
2,000
1,500
1,000
500
0
4
3
2
1
0
$ Million Times
Dividend Payout
2010/11 2011/12 2012/13 2013/14 2014/15
Interim Dividend (¢)
Final Dividend (¢)
Special Dividend (¢)
Payout Ratio ($)
150
120
90
60
30
0
80
70
60
50
40
Cents Per Cent
48 PERFORMANCE | Financial Review |
