Singapore Airlines 2015 Annual Report Download - page 7
Download and view the complete annual report
Please find page 7 of the 2015 Singapore Airlines annual report below. You can navigate through the pages in the report by either clicking on the pages listed below, or by using the keyword search tool below to find specific information within the annual report.-
 1
1 -
 2
2 -
 3
3 -
 4
4 -
 5
5 -
 6
6 -
 7
7 -
 8
8 -
 9
9 -
 10
10 -
 11
11 -
 12
12 -
 13
13 -
 14
14 -
 15
15 -
 16
16 -
 17
17 -
 18
18 -
19
-
20
-
21
-
22
-
23
-
24
-
25
-
26
-
27
-
28
-
29
-
30
-
31
-
32
-
33
-
34
-
35
-
36
-
37
-
38
-
39
-
40
-
41
-
42
-
43
-
44
-
45
-
46
-
47
-
48
-
49
-
50
-
51
-
52
-
53
-
54
-
55
-
56
-
57
-
58
-
59
-
60
-
61
-
62
-
63
-
64
-
65
-
66
-
67
-
68
-
69
-
70
-
71
-
72
-
73
-
74
-
75
-
76
-
77
-
78
-
79
-
80
-
81
-
82
-
83
-
84
-
85
-
86
-
87
-
88
-
89
-
90
-
91
-
92
-
93
-
94
-
95
-
96
-
97
-
98
-
99
-
100
-
101
-
102
-
103
-
104
-
105
-
106
-
107
-
108
-
109
-
110
-
111
-
112
-
113
-
114
-
115
-
116
-
117
-
118
-
119
-
120
-
121
-
122
-
123
-
124
-
125
-
126
-
127
-
128
-
129
-
130
-
131
-
132
-
133
-
134
-
135
-
136
-
137
-
138
-
139
-
140
-
141
-
142
-
143
-
144
-
145
-
146
-
147
-
148
-
149
-
150
-
151
-
152
-
153
-
154
-
155
-
156
-
157
-
158
-
159
-
160
-
161
-
162
-
163
-
164
-
165
-
166
-
167
-
168
-
169
-
170
-
171
-
172
-
173
-
174
-
175
-
176
-
177
-
178
-
179
-
180
-
181
-
182
-
183
-
184
-
185
-
186
-
187
-
188
-
189
-
190
-
191
-
192
-
193
-
194
-
195
-
196
-
197
-
198
-
199
-
200
-
201
-
202
-
203
-
204
-
205
-
206
-
207
-
208
-
209
-
210
-
211
-
212
-
213
-
214
-
215
-
216
-
217
-
218
-
219
-
220
-
221
-
222
-
223
-
224
 |
 |
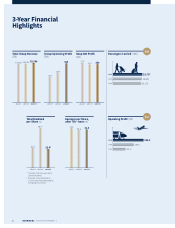
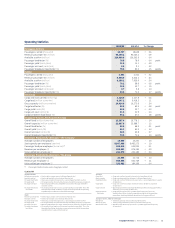
Operating Statistics
Singapore Airlines
Revenue passenger-km = Number of passengers carried x distance flown (in km)
Available seat-km = Number of available seats x distance flown (in km)
Passenger load factor = Revenue passenger-km expressed as a percentage of available seat-km
Passenger yield = Passenger revenue from scheduled services divided by revenue passenger-km
Passenger unit cost = Operating expenditure (less bellyhold revenue from SIA Cargo) divided by
available seat-km
Passenger breakeven = Passenger unit cost expressed as a percentage of passenger yield. This is the
load factor theoretical load factor at which passenger revenue equates to the operating
expenditure (less bellyhold revenue from SIA Cargo)
SilkAir
Revenue passenger-km = Number of passengers carried x distance flown (in km)
Available seat-km = Number of available seats x distance flown (in km)
Passenger load factor = Revenue passenger-km expressed as a percentage of available seat-km
Passenger yield = Passenger revenue from scheduled services divided by revenue passenger-km
Passenger unit cost = Operating expenditure (less cargo and mail revenue) divided by available seat-km
Passenger breakeven = Passenger unit cost expressed as a percentage of passenger yield. This is the
load factor theoretical load factor at which passenger revenue equates to the operating
expenditure (less cargo and mail revenue)
SIA Cargo
Cargo load = Cargo and mail load carried (in tonnes) x distance flown (in km)
Gross capacity = Cargo capacity production (in tonnes) x distance flown (in km)
Cargo load factor = Cargo and mail load (in tonne-km) expressed as a percentage of gross capacity
(in tonne-km)
Cargo yield = Cargo and mail revenue from scheduled services divided by cargo load
(in tonne-km)
Cargo unit cost = Operating expenditure (including bellyhold expenditure to Singapore Airlines)
divided by gross capacity (in tonne-km)
Cargo breakeven = Cargo unit cost expressed as a percentage of cargo yield. This is the
load factor theoretical load factor at which cargo revenue equates to the operating
expenditure (including bellyhold expenditure to Singapore Airlines)
Singapore Airlines, SilkAir and SIA Cargo
Overall load = Total load carried (in tonnes) x distance flown (in km)
Overall capacity = Total capacity production (in tonnes) x distance flown (in km)
Overall load factor = Overall load (in tonne-km) expressed as a percentage of overall capacity
(in tonne-km)
GLOSSARY
2014/15 2013/14 % Change
Singapore Airlines
Passengers carried (thousand) 18,737 18,628 + 0.6
Revenue passenger-km (million) 94,209.2 95,064.3 - 0.9
Available seat-km (million) 120,000.8 120,502.8 - 0.4
Passenger load factor (%) 78.5 78.9 - 0.4 point
Passenger yield (cents/pkm) 11.2 11.1 + 0.9
Passenger unit cost (cents/ask) 8.9 9.1 - 2.2
Passenger breakeven load factor (%) 79.5 82.0 - 2.5 points
SilkAir
Passengers carried (thousand) 3,553 3,411 + 4.2
Revenue passenger-km (million) 5,864.9 5,516.1 + 6.3
Available seat-km (million) 8,355.2 7,926.9 + 5.4
Passenger load factor (%) 70.2 69.6 + 0.6 point
Passenger yield (cents/pkm) 13.9 13.7 + 1.5
Passenger unit cost (cents/ask) 9.7 9.8 - 1.0
Passenger breakeven load factor (%) 69.8 71.5 - 1.7 points
SIA Cargo
Cargo and mail carried (million kg) 1,124.0 1,117.8 + 0.6
Cargo load (million tonne-km) 6,347.2 6,419.3 - 1.1
Gross capacity (million tonne-km) 10,024.9 10,273.6 - 2.4
Cargo load factor (%) 63.3 62.5 + 0.8 point
Cargo yield (cents/ltk) 32.8 32.7 + 0.3
Cargo unit cost (cents/ctk) 21.4 21.9 - 2.3
Cargo breakeven load factor (%) 65.2 67.0 - 1.8 points
Singapore Airlines, SilkAir and SIA Cargo
Overall load (million tonne-km) 15,557.4 15,778.1 - 1.4
Overall capacity (million tonne-km) 22,607.8 22,889.7 - 1.2
Overall load factor (%) 68.8 68.9 - 0.1 point
Overall yield (cents/ltk) 86.1 84.9 + 1.4
Overall unit cost (cents/ctk) 60.4 60.8 - 0.7
Overall breakeven load factor (%) 70.2 71.6 - 1.4 points
Employee Productivity (Average) – The Company
Average number of employees 14,040 14,240 - 1.4
Seat capacity per employee (seat-km) 8,547,066 8,462,275 + 1.0
Passenger load per employee (tonne-km) R1 625,516 625,995 - 0.1
Revenue per employee ($) 884,501 876,383 + 0.9
Value added per employee ($) 242,970 242,184 + 0.3
Employee Productivity (Average) – The Group
Average number of employees 23,963 23,716 + 1.0
Revenue per employee ($) 649,564 642,769 + 1.1
Value added per employee ($) 183,483 184,268 - 0.4
R1 Passenger load includes excess baggage carried.
Singapore Airlines | Annual Report FY2014/15 | 5