Singapore Airlines 2015 Annual Report Download - page 203
Download and view the complete annual report
Please find page 203 of the 2015 Singapore Airlines annual report below. You can navigate through the pages in the report by either clicking on the pages listed below, or by using the keyword search tool below to find specific information within the annual report.-
 1
1 -
2
-
3
-
4
-
5
-
6
-
7
-
8
-
9
-
10
-
11
-
12
-
13
-
14
-
15
-
16
-
17
-
18
-
19
-
20
-
21
-
22
-
23
-
24
-
25
-
26
-
27
-
28
-
29
-
30
-
31
-
32
-
33
-
34
-
35
-
36
-
37
-
38
-
39
-
40
-
41
-
42
-
43
-
44
-
45
-
46
-
47
-
48
-
49
-
50
-
51
-
52
-
53
-
54
-
55
-
56
-
57
-
58
-
59
-
60
-
61
-
62
-
63
-
64
-
65
-
66
-
67
-
68
-
69
-
70
-
71
-
72
-
73
-
74
-
75
-
76
-
77
-
78
-
79
-
80
-
81
-
82
-
83
-
84
-
85
-
86
-
87
-
88
-
89
-
90
-
91
-
92
-
93
-
94
-
95
-
96
-
97
-
98
-
99
-
100
-
101
-
102
-
103
-
104
-
105
-
106
-
107
-
108
-
109
-
110
-
111
-
112
-
113
-
114
-
115
-
116
-
117
-
118
-
119
-
120
-
121
-
122
-
123
-
124
-
125
-
126
-
127
-
128
-
129
-
130
-
131
-
132
-
133
-
134
-
135
-
136
-
137
-
138
-
139
-
140
-
141
-
142
-
143
-
144
-
145
-
146
-
147
-
148
-
149
-
150
-
151
-
152
-
153
-
154
-
155
-
156
-
157
-
158
-
159
-
160
-
161
-
162
-
163
-
164
-
165
-
166
-
167
-
168
-
169
-
170
-
171
-
172
-
173
-
174
-
175
-
176
-
177
-
178
-
179
-
180
-
181
-
182
-
183
-
184
-
185
-
186
-
187
-
188
-
189
-
190
-
191
-
192
-
 193
193 -
 194
194 -
 195
195 -
 196
196 -
 197
197 -
 198
198 -
 199
199 -
 200
200 -
 201
201 -
 202
202 -
 203
203 -
 204
204 -
 205
205 -
 206
206 -
 207
207 -
 208
208 -
 209
209 -
 210
210 -
 211
211 -
 212
212 -
 213
213 -
214
-
215
-
216
-
217
-
218
-
219
-
220
-
221
-
222
-
223
-
224
 |
 |

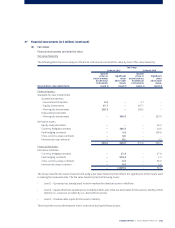
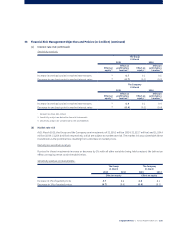
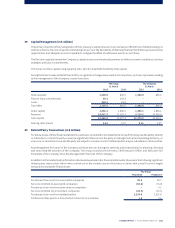
39 Capital Management (in $ million)
The primary objective of the management of the Company’s capital structure is to maintain an eicient mix of debt and equity in
order to achieve a low cost of capital, while taking into account the desirability of retaining financial flexibility to pursue business
opportunities and adequate access to liquidity to mitigate the eect of unforeseen events on cash flows.
The Directors regularly review the Company’s capital structure and make adjustments to reflect economic conditions, business
strategies and future commitments.
The Group monitors capital using a gearing ratio, which is total debt divided by total capital.
During the financial year ended 31 March 2015, no significant changes were made in the objectives, policies or processes relating
to the management of the Company’s capital structure.
The Group The Company
31 March 31 March
2015 2014 2015 2014
Notes payable 1,300.0 800.0 1,300.0 800.0
Finance lease commitments 99.3 143.2 – –
Loans 340.2 21.8 – –
Total debt 1,739.5 965.0 1,300.0 800.0
Share capital 1,856.1 1,856.1 1,856.1 1,856.1
Reserves 10,607.5 11,381.1 9,723.2 10,256.0
Total capital 12,463.6 13,237.2 11,579.3 12,112.1
Gearing ratio (times) 0.14 0.07 0.11 0.07
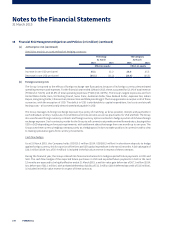
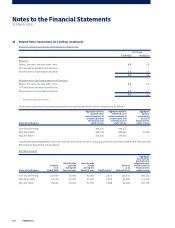
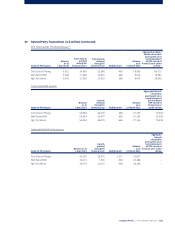
40 Related Party Transactions (in $ million)
For the purposes of these financial statements, parties are considered to be related to the Group if the Group has the ability, directly
or indirectly, to control the party or exercise significant influence over the party in making financial and operating decisions, or
vice versa, or where the Group and the party are subject to common control. Related parties may be individuals or other entities.
Key Management Personnel of the Company are those persons having the authority and responsibility for planning, directing
and controlling the activities of the Company. The Group considers the Directors, Chief Executive Oicer and Executive Vice
Presidents of the Company to be Key Management Personnel of the Company.
In addition to the related party information disclosed elsewhere in the financial statements, these were the following significant
related party transactions which were carried out in the normal course of business on terms that prevail in arm’s length
transactions during the financial year:
The Group
FY2014/15 FY2013/14
Purchases of services from associated companies 45.5 39.7
Services rendered to associated companies (83.6) (76.0)
Purchases of services from joint venture companies – 0.1
Services rendered to joint venture companies (28.3) (15.1)
Purchases of services from related parties 1,134.6 1,215.8
Professional fees paid to a firm of which a Director is a member 1.5 0.8
Singapore Airlines | Annual Report FY2014/15 |201