Singapore Airlines 2015 Annual Report Download - page 22
Download and view the complete annual report
Please find page 22 of the 2015 Singapore Airlines annual report below. You can navigate through the pages in the report by either clicking on the pages listed below, or by using the keyword search tool below to find specific information within the annual report.-
 1
1 -
2
-
3
-
4
-
5
-
6
-
7
-
8
-
9
-
10
-
11
-
 12
12 -
 13
13 -
 14
14 -
 15
15 -
 16
16 -
 17
17 -
 18
18 -
 19
19 -
 20
20 -
 21
21 -
 22
22 -
 23
23 -
 24
24 -
 25
25 -
 26
26 -
 27
27 -
 28
28 -
 29
29 -
 30
30 -
 31
31 -
 32
32 -
33
-
34
-
35
-
36
-
37
-
38
-
39
-
40
-
41
-
42
-
43
-
44
-
45
-
46
-
47
-
48
-
49
-
50
-
51
-
52
-
53
-
54
-
55
-
56
-
57
-
58
-
59
-
60
-
61
-
62
-
63
-
64
-
65
-
66
-
67
-
68
-
69
-
70
-
71
-
72
-
73
-
74
-
75
-
76
-
77
-
78
-
79
-
80
-
81
-
82
-
83
-
84
-
85
-
86
-
87
-
88
-
89
-
90
-
91
-
92
-
93
-
94
-
95
-
96
-
97
-
98
-
99
-
100
-
101
-
102
-
103
-
104
-
105
-
106
-
107
-
108
-
109
-
110
-
111
-
112
-
113
-
114
-
115
-
116
-
117
-
118
-
119
-
120
-
121
-
122
-
123
-
124
-
125
-
126
-
127
-
128
-
129
-
130
-
131
-
132
-
133
-
134
-
135
-
136
-
137
-
138
-
139
-
140
-
141
-
142
-
143
-
144
-
145
-
146
-
147
-
148
-
149
-
150
-
151
-
152
-
153
-
154
-
155
-
156
-
157
-
158
-
159
-
160
-
161
-
162
-
163
-
164
-
165
-
166
-
167
-
168
-
169
-
170
-
171
-
172
-
173
-
174
-
175
-
176
-
177
-
178
-
179
-
180
-
181
-
182
-
183
-
184
-
185
-
186
-
187
-
188
-
189
-
190
-
191
-
192
-
193
-
194
-
195
-
196
-
197
-
198
-
199
-
200
-
201
-
202
-
203
-
204
-
205
-
206
-
207
-
208
-
209
-
210
-
211
-
212
-
213
-
214
-
215
-
216
-
217
-
218
-
219
-
220
-
221
-
222
-
223
-
224
 |
 |

Operating
Review
The Singapore Airlines Group
recorded a $151 million increase
in full-year operating profit amid
lower fuel costs.
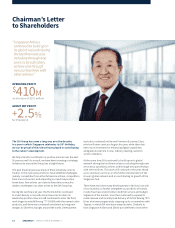
The Year in Review
The Singapore Airlines Group earned an operating
profit of $410 million for the financial year ended
31 March 2015, a 58.3 per cent increase from
last year, while net profit attributable to equity
shareholders grew 2.5 per cent to $368 million.
Financial Year Operating Results
Excluding Tiger Airways1
Tiger Airways became a subsidiary of the Group
with eect from October 2014. Excluding Tiger
Airways, the Group saw an increase in operating
profit of $160 million to $419 million despite a
marginal drop in Group revenue to $15,209 million.
Passenger revenue improved 0.9 per cent,
as Group passenger carriage and yields saw
slight improvement. Group expenditure fell
$195 million from the last financial year, with
the outstanding feature being a $263 million
reduction in net fuel cost.
Operating Performance
During the year in review, passenger carriage
(in revenue passenger kilometres) for the Parent
Airline Company declined 0.9 per cent on the back
of a 0.4 per cent drop in capacity (in available
seat-kilometres). Consequently, passenger load
factor dipped 0.4 percentage points to 78.5 per
cent. SilkAir registered a passenger load factor
of 70.2 per cent, a 0.6 percentage-point increase
from last year. With eorts to expand the regional
network, passenger carriage rose 6.3 per cent,
outpacing the 5.4 per cent growth in capacity.
SIA Cargo’s freight carriage (in load tonne-
kilometres) fell 1.1 per cent, against a 2.4 per
cent reduction in capacity (in capacity tonne-
kilometres). Load factor was therefore up
0.8 percentage points to 63.3 per cent.
Outlook
Looking ahead, market conditions remain
challenging amid an uncertain global economic
outlook. Demand in key markets is so, primarily
on Americas and European routes. Competition
remains intense as other airlines continue to inject
capacity with aggressive pricing. Depreciation
of key revenue-generating currencies will place
further pressure on yield and demand, while the
stronger US Dollar will increase operating costs,
year-on-year. To meet the challenges ahead, the
Group will continue its disciplined approach in
capacity deployment and cost management,
while enhancing product oerings and leveraging
the various airline subsidiaries to tap demand
across a diverse range of travel segments.
Supported by a strong balance sheet, the Group
is in a strong position to maintain its competitive
edge through the many strategic initiatives that
are in place.
The Board of Directors recommends a final
dividend of 17 cents per share for FY2014/15.
Including the interim dividend of 5 cents per
share paid on 27 November 2014, the total
dividend for FY2014/15 will be 22 cents per share.
The final dividend (tax exempt, one-tier) would
be paid on 19 August 2015 to shareholders as at
5 August 2015.
GROUP OPERATING
PROFIT OF
$410M
a 58.3% increase
from last year
NET PROFIT
ATTRIBUTABLE
TO EQUITY
SHAREHOLDERS
+2.5%
to $368 million
1. Group results exclude
Tiger Airways, which was
consolidated with eect
from October 2014, to
facilitate a meaningful
year-on-year comparison
of results, as the results for
Tiger Airways would not
be included as part of SIA
Group in FY2013/14.
20 PERFORMANCE | Operating Review |