Singapore Airlines 2015 Annual Report Download - page 51
Download and view the complete annual report
Please find page 51 of the 2015 Singapore Airlines annual report below. You can navigate through the pages in the report by either clicking on the pages listed below, or by using the keyword search tool below to find specific information within the annual report.-
 1
1 -
2
-
3
-
4
-
5
-
6
-
7
-
8
-
9
-
10
-
11
-
12
-
13
-
14
-
15
-
16
-
17
-
18
-
19
-
20
-
21
-
22
-
23
-
24
-
25
-
26
-
27
-
28
-
29
-
30
-
31
-
32
-
33
-
34
-
35
-
36
-
37
-
38
-
39
-
40
-
 41
41 -
 42
42 -
 43
43 -
 44
44 -
 45
45 -
 46
46 -
 47
47 -
 48
48 -
 49
49 -
 50
50 -
 51
51 -
 52
52 -
 53
53 -
 54
54 -
 55
55 -
 56
56 -
 57
57 -
 58
58 -
 59
59 -
 60
60 -
 61
61 -
62
-
63
-
64
-
65
-
66
-
67
-
68
-
69
-
70
-
71
-
72
-
73
-
74
-
75
-
76
-
77
-
78
-
79
-
80
-
81
-
82
-
83
-
84
-
85
-
86
-
87
-
88
-
89
-
90
-
91
-
92
-
93
-
94
-
95
-
96
-
97
-
98
-
99
-
100
-
101
-
102
-
103
-
104
-
105
-
106
-
107
-
108
-
109
-
110
-
111
-
112
-
113
-
114
-
115
-
116
-
117
-
118
-
119
-
120
-
121
-
122
-
123
-
124
-
125
-
126
-
127
-
128
-
129
-
130
-
131
-
132
-
133
-
134
-
135
-
136
-
137
-
138
-
139
-
140
-
141
-
142
-
143
-
144
-
145
-
146
-
147
-
148
-
149
-
150
-
151
-
152
-
153
-
154
-
155
-
156
-
157
-
158
-
159
-
160
-
161
-
162
-
163
-
164
-
165
-
166
-
167
-
168
-
169
-
170
-
171
-
172
-
173
-
174
-
175
-
176
-
177
-
178
-
179
-
180
-
181
-
182
-
183
-
184
-
185
-
186
-
187
-
188
-
189
-
190
-
191
-
192
-
193
-
194
-
195
-
196
-
197
-
198
-
199
-
200
-
201
-
202
-
203
-
204
-
205
-
206
-
207
-
208
-
209
-
210
-
211
-
212
-
213
-
214
-
215
-
216
-
217
-
218
-
219
-
220
-
221
-
222
-
223
-
224
 |
 |

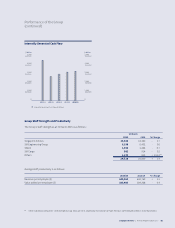
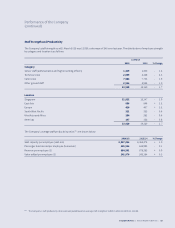
The Group’s sta strength as at 31 March 2015 is as follows:
31 March
2015 2014 % Change
Singapore Airlines 13,920 14,160 - 1.7
SIA Engineering Group 6,198 6,432 - 3.6
SilkAir 1,452 1,462 - 0.7
SIA Cargo 882 914 - 3.5
Others 1,674 832 + 101.2 R2
24,126 23,800 + 1.4
Average staff productivity is as follows:
2014/15 2013/14 % Change
Revenue per employee ($) 649,564 642,769 + 1.1
Value added per employee ($) 183,483 184,268 - 0.4
Group Sta Strength and Productivity
Internally Generated Cash Flow
2010/11 2011/12 2012/13 2013/14 2014/15
Internally Generated Cash Flow ($ Million)
5,000
4,000
3,000
2,000
1,000
0
5,000
4,000
3,000
2,000
1,000
0
$ Million $ Million
R2 Other subsidiary companies’ sta strength was up 101.2 per cent, largely due to inclusion of Tiger Airways’ sta strength of 840 as at 31 March 2015.
Performance of the Group
(continued)
Singapore Airlines | Annual Report FY2014/15 | 49