Singapore Airlines 2015 Annual Report Download - page 53
Download and view the complete annual report
Please find page 53 of the 2015 Singapore Airlines annual report below. You can navigate through the pages in the report by either clicking on the pages listed below, or by using the keyword search tool below to find specific information within the annual report.-
 1
1 -
2
-
3
-
4
-
5
-
6
-
7
-
8
-
9
-
10
-
11
-
12
-
13
-
14
-
15
-
16
-
17
-
18
-
19
-
20
-
21
-
22
-
23
-
24
-
25
-
26
-
27
-
28
-
29
-
30
-
31
-
32
-
33
-
34
-
35
-
36
-
37
-
38
-
39
-
40
-
41
-
42
-
 43
43 -
 44
44 -
 45
45 -
 46
46 -
 47
47 -
 48
48 -
 49
49 -
 50
50 -
 51
51 -
 52
52 -
 53
53 -
 54
54 -
 55
55 -
 56
56 -
 57
57 -
 58
58 -
 59
59 -
 60
60 -
 61
61 -
 62
62 -
 63
63 -
64
-
65
-
66
-
67
-
68
-
69
-
70
-
71
-
72
-
73
-
74
-
75
-
76
-
77
-
78
-
79
-
80
-
81
-
82
-
83
-
84
-
85
-
86
-
87
-
88
-
89
-
90
-
91
-
92
-
93
-
94
-
95
-
96
-
97
-
98
-
99
-
100
-
101
-
102
-
103
-
104
-
105
-
106
-
107
-
108
-
109
-
110
-
111
-
112
-
113
-
114
-
115
-
116
-
117
-
118
-
119
-
120
-
121
-
122
-
123
-
124
-
125
-
126
-
127
-
128
-
129
-
130
-
131
-
132
-
133
-
134
-
135
-
136
-
137
-
138
-
139
-
140
-
141
-
142
-
143
-
144
-
145
-
146
-
147
-
148
-
149
-
150
-
151
-
152
-
153
-
154
-
155
-
156
-
157
-
158
-
159
-
160
-
161
-
162
-
163
-
164
-
165
-
166
-
167
-
168
-
169
-
170
-
171
-
172
-
173
-
174
-
175
-
176
-
177
-
178
-
179
-
180
-
181
-
182
-
183
-
184
-
185
-
186
-
187
-
188
-
189
-
190
-
191
-
192
-
193
-
194
-
195
-
196
-
197
-
198
-
199
-
200
-
201
-
202
-
203
-
204
-
205
-
206
-
207
-
208
-
209
-
210
-
211
-
212
-
213
-
214
-
215
-
216
-
217
-
218
-
219
-
220
-
221
-
222
-
223
-
224
 |
 |

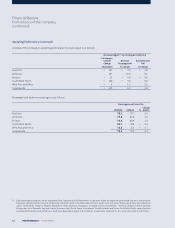
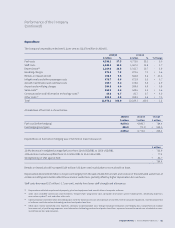
Operating Performance
2014/15 2013/14 % Change
Passengers carried (thousand) 18,737 18,628 + 0.6
Available seat-km (million) 120,000.8 120,502.8 - 0.4
Revenue passenger-km (million) 94,209.2 95,064.3 - 0.9
Passenger load factor (%) 78.5 78.9 - 0.4 point
Passenger yield (¢/pkm) 11.2 11.1 + 0.9
Passenger unit cost (¢/ask) 8.9 9.1 - 2.2
Passenger breakeven load factor (%) 79.5 82.0 - 2.5 points
During the financial year, the Company continued to be impacted by intense competition and economic uncertainties in key
markets. Passenger load factor of 78.5 per cent was 0.4 percentage point lower year-on-year, as the decline in passenger traic of
0.9 per cent trailed the capacity reduction of 0.4 per cent. Yields improved by 0.9 per cent against last year to 11.2 ¢/pkm, whereas
passenger unit cost reduced by 2.2 per cent primarily as result of lower fuel costs. Consequently, the passenger breakeven load
factor fell by 2.5 percentage points to 79.5 percent.
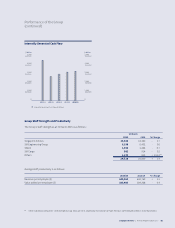
Available Seat Capacity, Passenger Traic
and Load Factor
2010/11 2011/12 2012/13 2013/14 2014/15
Available Seat-km (Million)
Revenue Passenger-km (Million)
Passenger Load Factor (%)
140,000
120,000
100,000
80,000
60,000
40,000
20,000
0
85
83
81
79
77
75
Million Per Cent
Performance of the Company
Singapore Airlines | Annual Report FY2014/15 | 51