Singapore Airlines 2015 Annual Report Download - page 180
Download and view the complete annual report
Please find page 180 of the 2015 Singapore Airlines annual report below. You can navigate through the pages in the report by either clicking on the pages listed below, or by using the keyword search tool below to find specific information within the annual report.-
 1
1 -
2
-
3
-
4
-
5
-
6
-
7
-
8
-
9
-
10
-
11
-
12
-
13
-
14
-
15
-
16
-
17
-
18
-
19
-
20
-
21
-
22
-
23
-
24
-
25
-
26
-
27
-
28
-
29
-
30
-
31
-
32
-
33
-
34
-
35
-
36
-
37
-
38
-
39
-
40
-
41
-
42
-
43
-
44
-
45
-
46
-
47
-
48
-
49
-
50
-
51
-
52
-
53
-
54
-
55
-
56
-
57
-
58
-
59
-
60
-
61
-
62
-
63
-
64
-
65
-
66
-
67
-
68
-
69
-
70
-
71
-
72
-
73
-
74
-
75
-
76
-
77
-
78
-
79
-
80
-
81
-
82
-
83
-
84
-
85
-
86
-
87
-
88
-
89
-
90
-
91
-
92
-
93
-
94
-
95
-
96
-
97
-
98
-
99
-
100
-
101
-
102
-
103
-
104
-
105
-
106
-
107
-
108
-
109
-
110
-
111
-
112
-
113
-
114
-
115
-
116
-
117
-
118
-
119
-
120
-
121
-
122
-
123
-
124
-
125
-
126
-
127
-
128
-
129
-
130
-
131
-
132
-
133
-
134
-
135
-
136
-
137
-
138
-
139
-
140
-
141
-
142
-
143
-
144
-
145
-
146
-
147
-
148
-
149
-
150
-
151
-
152
-
153
-
154
-
155
-
156
-
157
-
158
-
159
-
160
-
161
-
162
-
163
-
164
-
165
-
166
-
167
-
168
-
169
-
 170
170 -
 171
171 -
 172
172 -
 173
173 -
 174
174 -
 175
175 -
 176
176 -
 177
177 -
 178
178 -
 179
179 -
 180
180 -
 181
181 -
 182
182 -
 183
183 -
 184
184 -
 185
185 -
 186
186 -
 187
187 -
 188
188 -
 189
189 -
 190
190 -
191
-
192
-
193
-
194
-
195
-
196
-
197
-
198
-
199
-
200
-
201
-
202
-
203
-
204
-
205
-
206
-
207
-
208
-
209
-
210
-
211
-
212
-
213
-
214
-
215
-
216
-
217
-
218
-
219
-
220
-
221
-
222
-
223
-
224
 |
 |

Notes to the Financial Statements
31 March 2015
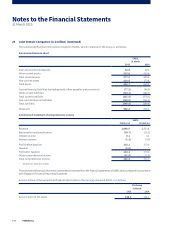
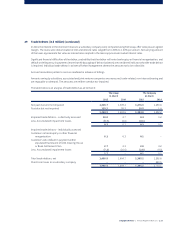
29 Trade Debtors (in $ million) (continued)
Included in trade and other debtors are amounts owing by related parties of $5.2 million (2014: $1.9 million) and $0.9 million
(2014: $0.6 million) for the Group and Company respectively.
Trade debtors are stated aer accumulated impairment losses. An analysis of the accumulated impairment losses is as follows:
The Group The Company
31 March 31 March
2015 2014 2015 2014
Balance at 1 April 15.2 14.3 4.0 2.0
Acquisition of a subsidiary company 1.3 – – –
Charged/(Written back) during the year 0.7 1.1 (1.1) 2.0
Written off during the year (0.4) (0.2) – –
Balance at 31 March 16.8 15.2 2.9 4.0
Bad debts written off directly to profit and
loss account, net of debts recovered 6.3 0.4 1.3 0.1
As at 31 March 2015, the composition of trade debtors held in foreign currencies by the Group is as follows: USD – 26.5%
(2014: 31.0%), GBP – 5.0% (2014: 5.1%), EUR – 4.6% (2014: 6.0%), AUD – 4.5% (2014: 7.8%) and JPY – 2.6% (2014: 3.3%).
There was no loan to Directors of the Company.
The Company’s amounts owing by subsidiary companies that are o-set are as follows:
The Company
31 March
2015 2014
Gross carrying amounts of receivables 525.0 206.3
Gross amounts offset in the balance sheet of payables (213.5) (26.9)
Net amounts in the balance sheet 311.5 179.4
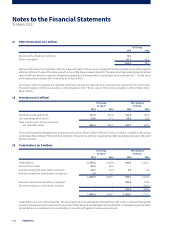
30 Deposits and Other Debtors (in $ million)
The Group The Company
31 March 31 March
2015 2014 2015 2014
Deposits 15.5 16.0 8.4 8.7
Other debtors 27.9 34.1 14.1 11.6
43.4 50.1 22.5 20.3
178 FINANCIAL