Singapore Airlines 2015 Annual Report Download - page 202
Download and view the complete annual report
Please find page 202 of the 2015 Singapore Airlines annual report below. You can navigate through the pages in the report by either clicking on the pages listed below, or by using the keyword search tool below to find specific information within the annual report.-
 1
1 -
2
-
3
-
4
-
5
-
6
-
7
-
8
-
9
-
10
-
11
-
12
-
13
-
14
-
15
-
16
-
17
-
18
-
19
-
20
-
21
-
22
-
23
-
24
-
25
-
26
-
27
-
28
-
29
-
30
-
31
-
32
-
33
-
34
-
35
-
36
-
37
-
38
-
39
-
40
-
41
-
42
-
43
-
44
-
45
-
46
-
47
-
48
-
49
-
50
-
51
-
52
-
53
-
54
-
55
-
56
-
57
-
58
-
59
-
60
-
61
-
62
-
63
-
64
-
65
-
66
-
67
-
68
-
69
-
70
-
71
-
72
-
73
-
74
-
75
-
76
-
77
-
78
-
79
-
80
-
81
-
82
-
83
-
84
-
85
-
86
-
87
-
88
-
89
-
90
-
91
-
92
-
93
-
94
-
95
-
96
-
97
-
98
-
99
-
100
-
101
-
102
-
103
-
104
-
105
-
106
-
107
-
108
-
109
-
110
-
111
-
112
-
113
-
114
-
115
-
116
-
117
-
118
-
119
-
120
-
121
-
122
-
123
-
124
-
125
-
126
-
127
-
128
-
129
-
130
-
131
-
132
-
133
-
134
-
135
-
136
-
137
-
138
-
139
-
140
-
141
-
142
-
143
-
144
-
145
-
146
-
147
-
148
-
149
-
150
-
151
-
152
-
153
-
154
-
155
-
156
-
157
-
158
-
159
-
160
-
161
-
162
-
163
-
164
-
165
-
166
-
167
-
168
-
169
-
170
-
171
-
172
-
173
-
174
-
175
-
176
-
177
-
178
-
179
-
180
-
181
-
182
-
183
-
184
-
185
-
186
-
187
-
188
-
189
-
190
-
191
-
 192
192 -
 193
193 -
 194
194 -
 195
195 -
 196
196 -
 197
197 -
 198
198 -
 199
199 -
 200
200 -
 201
201 -
 202
202 -
 203
203 -
 204
204 -
 205
205 -
 206
206 -
 207
207 -
 208
208 -
 209
209 -
 210
210 -
 211
211 -
 212
212 -
213
-
214
-
215
-
216
-
217
-
218
-
219
-
220
-
221
-
222
-
223
-
224
 |
 |

Notes to the Financial Statements
31 March 2015
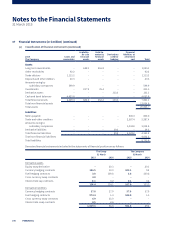
38 Financial Risk Management Objectives and Policies (in $ million) (continued)
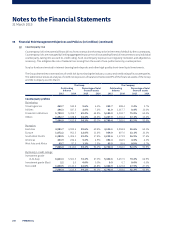
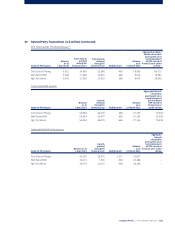
(g) Counterparty risk
Counterparty risk is the potential financial loss from a transaction that may arise in the event of default by the counterparty.
Counterparty risks are managed by limiting aggregated exposure on all outstanding financial instruments to any individual
counterparty, taking into account its credit rating. Such counterparty exposures are regularly reviewed, and adjusted as
necessary. This mitigates the risk of material loss arising from the event of non-performance by counterparties.
Surplus funds are invested in interest-bearing bank deposits and other high quality short-term liquid investments.
The Group determines concentrations of credit risk by monitoring the industry, country and credit rating of its counterparties.
The table below shows an analysis of credit risk exposures of balances that exceed 5% of the financial assets of the Group
and the Company as at 31 March:
The Group The Company
Outstanding
balance
Percentage of total
financial assets
Outstanding
balance
Percentage of total
financial assets
2015 2014 2015 2014 2015 2014 2015 2014
Counterparty profiles
By industry:
Travel agencies 468.7 534.8 5.6% 6.5% 249.7 288.4 3.4% 3.7%
Airlines 246.3 587.5 2.9% 7.2% 61.9 1,017.7 0.8% 13.0%
Financial institutions 5,798.3 5,302.7 69.4% 64.8% 5,180.9 5,034.7 71.0% 64.0%
Others 1,352.7 1,188.8 16.2% 14.6% 1,247.9 1,041.2 17.1% 13.2%
7,866.0 7,613.8 94.1% 93.1% 6,740.4 7,382.0 92.3% 93.9%
By region:
East Asia 4,981.7 4,923.5 59.6% 60.2% 4,134.1 4,958.8 56.6% 63.1%
Europe 1,072.2 951.5 12.8% 11.6% 954.9 807.0 13.1% 10.3%
South West Pacific 1,288.5 1,405.1 15.4% 17.2% 1,233.6 1,373.9 16.9% 17.5%
Americas 433.9 236.2 5.2% 2.9% 352.3 182.5 4.8% 2.3%
West Asia and Africa 89.7 97.5 1.1% 1.2% 65.5 59.8 0.9% 0.7%
7,866.0 7,613.8 94.1% 93.1% 6,740.4 7,382.0 92.3% 93.9%
By Moody’s credit ratings:
Investment grade
(A to Aaa) 6,023.3 5,501.5 72.1% 67.3% 5,434.6 5,257.5 74.4% 66.9%
Investment grade (Baa) 2.2 2.0 0.0% 0.0% 0.9 0.7 0.0% 0.0%
Non-rated 1,840.5 2,110.3 22.0% 25.8% 1,304.9 2,123.8 17.9% 27.0%
7,866.0 7,613.8 94.1% 93.1% 6,740.4 7,382.0 92.3% 93.9%
200 FINANCIAL