Singapore Airlines 2010 Annual Report Download - page 82
Download and view the complete annual report
Please find page 82 of the 2010 Singapore Airlines annual report below. You can navigate through the pages in the report by either clicking on the pages listed below, or by using the keyword search tool below to find specific information within the annual report.-
 1
1 -
2
-
3
-
4
-
5
-
6
-
7
-
8
-
9
-
10
-
11
-
12
-
13
-
14
-
15
-
16
-
17
-
18
-
19
-
20
-
21
-
22
-
23
-
24
-
25
-
26
-
27
-
28
-
29
-
30
-
31
-
32
-
33
-
34
-
35
-
36
-
37
-
38
-
39
-
40
-
41
-
42
-
43
-
44
-
45
-
46
-
47
-
48
-
49
-
50
-
51
-
52
-
53
-
54
-
55
-
56
-
57
-
58
-
59
-
60
-
61
-
62
-
63
-
64
-
65
-
66
-
67
-
68
-
69
-
70
-
71
-
 72
72 -
 73
73 -
 74
74 -
 75
75 -
 76
76 -
 77
77 -
 78
78 -
 79
79 -
 80
80 -
 81
81 -
 82
82 -
 83
83 -
 84
84 -
 85
85 -
 86
86 -
 87
87 -
 88
88 -
 89
89 -
 90
90 -
 91
91 -
 92
92 -
93
-
94
-
95
-
96
-
97
-
98
-
99
-
100
-
101
-
102
-
103
-
104
-
105
-
106
-
107
-
108
-
109
-
110
-
111
-
112
-
113
-
114
-
115
-
116
-
117
-
118
-
119
-
120
-
121
-
122
-
123
-
124
-
125
-
126
-
127
-
128
-
129
-
130
-
131
-
132
-
133
-
134
-
135
-
136
-
137
-
138
-
139
-
140
-
141
-
142
-
143
-
144
-
145
-
146
-
147
-
148
-
149
-
150
-
151
-
152
-
153
-
154
-
155
-
156
-
157
-
158
-
159
-
160
-
161
-
162
-
163
-
164
-
165
-
166
-
167
-
168
-
169
-
170
-
171
-
172
-
173
-
174
-
175
-
176
-
177
-
178
-
179
-
180
-
181
-
182
-
183
-
184
-
185
-
186
-
187
-
188
-
189
-
190
-
191
-
192
-
193
-
194
-
195
-
196
-
197
-
198
-
199
-
200
-
201
-
202
-
203
-
204
-
205
-
206
-
207
-
208
-
209
-
210
-
211
-
212
-
213
-
214
 |
 |

SINGAPORE AIRLINES
80
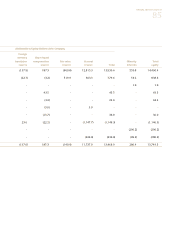
consolidated profit and loss account
for the financial year ended 31 march 2010 (in $ million)
The Group
Notes 2009-10 2008-09
REVENUE 12,707.3 15,996.3
EXPENDITURE
Staff costs 5 2,159.4 2,545.9
Fuel costs 4,194.5 6,408.4
Depreciation 19, 21 1,713.8 1,649.7
Impairment of property, plant and equipment 19 6.1 41.4
Amortisation of intangible assets 20 42.7 45.5
Aircraft maintenance and overhaul costs 342.4 381.6
Commission and incentives 316.5 394.5
Landing, parking and overflying charges 588.6 656.9
Handling charges 784.9 580.7
Rentals on leased aircraft 552.9 487.8
Material costs 375.4 385.3
Inflight meals 347.7 231.0
Advertising and sales costs 210.3 240.3
Insurance expenses 57.6 60.4
Company accommodation and utilities 142.0 187.2
Other passenger costs 130.4 146.7
Crew expenses 153.4 184.7
Other operating expenses 525.5 464.7
12,644.1 15,092.7
OPERATING PROFIT 6 63.2 903.6
Finance charges 7 (68.9) (89.7)
Interest income 8 49.5 96.0
Surplus on disposal of aircraft, spares and spare engines 25.4 60.6
Dividends from long-term investments, gross 33.0 23.7
Other non-operating items 9 34.2 29.4
Share of profits of joint venture companies 24 56.1 63.9
Share of profits of associated companies 93.0 111.1
PROFIT BEFORE TAXATION 285.5 1,198.6
TAXATION 10
Taxation expense (6.0) (190.0)
Adjustment for reduction in Singapore statutory tax rate - 138.2
(6.0) (51.8)
PROFIT FOR THE FINANCIAL YEAR 279.5 1,146.8
PROFIT ATTRIBUTABLE TO:
EQUITY HOLDERS OF THE COMPANY 215.8 1,061.5
MINORITY INTERESTS 63.7 85.3
279.5 1,146.8
BASIC EARNINGS PER SHARE (CENTS) 11 18.2 89.6
DILUTED EARNINGS PER SHARE (CENTS) 11 18.0 89.1
The accompanying accounting policies and explanatory notes form an integral part of the financial statements.