Singapore Airlines 2010 Annual Report Download - page 135
Download and view the complete annual report
Please find page 135 of the 2010 Singapore Airlines annual report below. You can navigate through the pages in the report by either clicking on the pages listed below, or by using the keyword search tool below to find specific information within the annual report.-
 1
1 -
2
-
3
-
4
-
5
-
6
-
7
-
8
-
9
-
10
-
11
-
12
-
13
-
14
-
15
-
16
-
17
-
18
-
19
-
20
-
21
-
22
-
23
-
24
-
25
-
26
-
27
-
28
-
29
-
30
-
31
-
32
-
33
-
34
-
35
-
36
-
37
-
38
-
39
-
40
-
41
-
42
-
43
-
44
-
45
-
46
-
47
-
48
-
49
-
50
-
51
-
52
-
53
-
54
-
55
-
56
-
57
-
58
-
59
-
60
-
61
-
62
-
63
-
64
-
65
-
66
-
67
-
68
-
69
-
70
-
71
-
72
-
73
-
74
-
75
-
76
-
77
-
78
-
79
-
80
-
81
-
82
-
83
-
84
-
85
-
86
-
87
-
88
-
89
-
90
-
91
-
92
-
93
-
94
-
95
-
96
-
97
-
98
-
99
-
100
-
101
-
102
-
103
-
104
-
105
-
106
-
107
-
108
-
109
-
110
-
111
-
112
-
113
-
114
-
115
-
116
-
117
-
118
-
119
-
120
-
121
-
122
-
123
-
124
-
 125
125 -
 126
126 -
 127
127 -
 128
128 -
 129
129 -
 130
130 -
 131
131 -
 132
132 -
 133
133 -
 134
134 -
 135
135 -
 136
136 -
 137
137 -
 138
138 -
 139
139 -
 140
140 -
 141
141 -
 142
142 -
 143
143 -
 144
144 -
 145
145 -
146
-
147
-
148
-
149
-
150
-
151
-
152
-
153
-
154
-
155
-
156
-
157
-
158
-
159
-
160
-
161
-
162
-
163
-
164
-
165
-
166
-
167
-
168
-
169
-
170
-
171
-
172
-
173
-
174
-
175
-
176
-
177
-
178
-
179
-
180
-
181
-
182
-
183
-
184
-
185
-
186
-
187
-
188
-
189
-
190
-
191
-
192
-
193
-
194
-
195
-
196
-
197
-
198
-
199
-
200
-
201
-
202
-
203
-
204
-
205
-
206
-
207
-
208
-
209
-
210
-
211
-
212
-
213
-
214
 |
 |

ANNUAL REPORT 2009/10
133
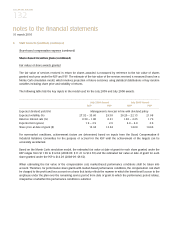
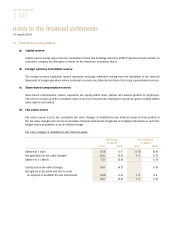
5 Staff Costs (in $ million) (continued)
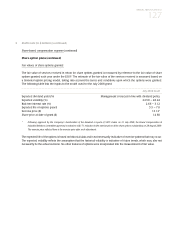
Share-based compensation expense (continued)
Share-based incentive plans (continued)
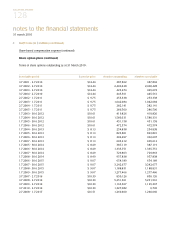
Fair values of share awards granted (continued)
For performance share grants with non-market conditions, the Group revises its estimates of the number of share
grants expected to vest and corresponding adjustments are made to the profit and loss account and share-based
compensation reserve.
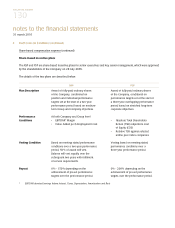
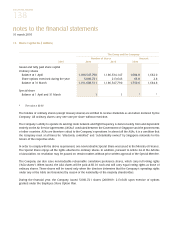
Under the PSP, eligible key senior management are required to hold a portion of the shares released to them under a
share ownership guideline which requires them to maintain a beneficial ownership stake in the Company, thus further
aligning their interests with shareholders.
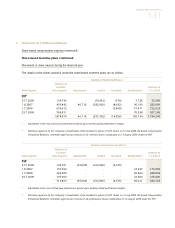
The number of contingent shares granted but not released as at 31 March 2010, were 1,734,240 (2009: 1,287,203)
and 644,163 (2009: 524,853) for RSP and PSP respectively. Based on the achievement factor, the actual release of the
awards could range from zero to a maximum of 2,424,156 (2009: 1,516,694) and 1,199,877 (2009: 787,280) fully-
paid ordinary shares of the Company, for RSP and PSP respectively.
Details and terms of the SIAEC RSP and SIAEC PSP have been disclosed in the Annual Report of SIA Engineering
Company Limited.
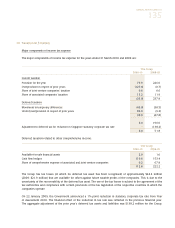
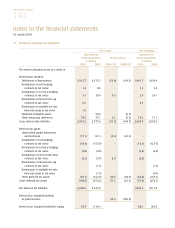
6 Operating Profit (in $ million)
Operating profit for the financial year was arrived at after charging/(crediting):
The Group
2009-10 2008-09
Interest income from short-term investments (0.9) (0.9)
Dividend income from short-term investments (0.7) (0.8)
(Surplus)/Loss on disposal of short-term investments (3.6) 4.7
Income from operating lease of aircraft (1.0) (10.5)
Amortisation of deferred gain on sale and operating leaseback transactions (64.7) (86.1)
Bad debts written off 0.8 2.4
Impairment of trade debtors - 12.3
Surplus on disposal of non-current assets - (2.1)
Professional fees paid to a firm of which a director is a member 0.5 0.1
Remuneration for auditors of the Company
Audit fees 1.6 1.7
Non-audit fees 0.9 1.4
Exchange loss, net 54.3 73.3
Currency hedging loss/(gain) 17.7 (138.6)
Fuel hedging loss recognised in “Fuel costs” 558.0 348.3
Ineffectiveness of fuel hedging contracts recognised in “Fuel costs” 0.3 4.0