Singapore Airlines 2010 Annual Report Download - page 189
Download and view the complete annual report
Please find page 189 of the 2010 Singapore Airlines annual report below. You can navigate through the pages in the report by either clicking on the pages listed below, or by using the keyword search tool below to find specific information within the annual report.-
 1
1 -
2
-
3
-
4
-
5
-
6
-
7
-
8
-
9
-
10
-
11
-
12
-
13
-
14
-
15
-
16
-
17
-
18
-
19
-
20
-
21
-
22
-
23
-
24
-
25
-
26
-
27
-
28
-
29
-
30
-
31
-
32
-
33
-
34
-
35
-
36
-
37
-
38
-
39
-
40
-
41
-
42
-
43
-
44
-
45
-
46
-
47
-
48
-
49
-
50
-
51
-
52
-
53
-
54
-
55
-
56
-
57
-
58
-
59
-
60
-
61
-
62
-
63
-
64
-
65
-
66
-
67
-
68
-
69
-
70
-
71
-
72
-
73
-
74
-
75
-
76
-
77
-
78
-
79
-
80
-
81
-
82
-
83
-
84
-
85
-
86
-
87
-
88
-
89
-
90
-
91
-
92
-
93
-
94
-
95
-
96
-
97
-
98
-
99
-
100
-
101
-
102
-
103
-
104
-
105
-
106
-
107
-
108
-
109
-
110
-
111
-
112
-
113
-
114
-
115
-
116
-
117
-
118
-
119
-
120
-
121
-
122
-
123
-
124
-
125
-
126
-
127
-
128
-
129
-
130
-
131
-
132
-
133
-
134
-
135
-
136
-
137
-
138
-
139
-
140
-
141
-
142
-
143
-
144
-
145
-
146
-
147
-
148
-
149
-
150
-
151
-
152
-
153
-
154
-
155
-
156
-
157
-
158
-
159
-
160
-
161
-
162
-
163
-
164
-
165
-
166
-
167
-
168
-
169
-
170
-
171
-
172
-
173
-
174
-
175
-
176
-
177
-
178
-
 179
179 -
 180
180 -
 181
181 -
 182
182 -
 183
183 -
 184
184 -
 185
185 -
 186
186 -
 187
187 -
 188
188 -
 189
189 -
 190
190 -
 191
191 -
 192
192 -
 193
193 -
 194
194 -
 195
195 -
 196
196 -
 197
197 -
 198
198 -
 199
199 -
200
-
201
-
202
-
203
-
204
-
205
-
206
-
207
-
208
-
209
-
210
-
211
-
212
-
213
-
214
 |
 |

ANNUAL REPORT 2009/10
187
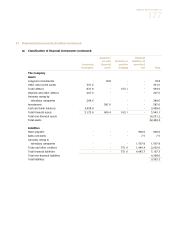
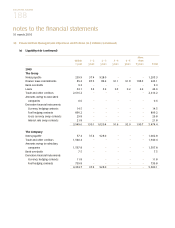
38 Financial Risk Management Objectives and Policies (in $ million) (continued)
(e) Liquidity risk (continued)
The maturity profile of the financial liabilities of the Group and the Company is as follows. The amounts disclosed
in the table are the contractual undiscounted cash flows. Balances due within 12 months approximate their
carrying amounts as the impact of discounting is insignificant.
More
Within 1 - 2 2 - 3 3 - 4 4 - 5 than
1 year years years years years 5 years Total
2010
The Group
Notes payable 37.4 928.0 - - - - 965.4
Finance lease commitments 78.2 80.4 82.5 83.3 64.3 106.3 495.0
Trade and other creditors 2,295.1 - - - - - 2,295.1
Amounts owing to associated
companies 2.0 - - - - - 2.0
Derivative financial instruments:
Currency hedging contracts 17.3 - - - - - 17.3
Fuel hedging contracts 112.9 - - - - - 112.9
Cross currency swap contracts 43.5 - - - - - 43.5
Interest rate swap contracts 29.9 - - - - - 29.9
2,616.3 1,008.4 82.5 83.3 64.3 106.3 3,961.1
The Company
Notes payable 37.4 928.0 - - - - 965.4
Trade and other creditors 1,755.5 - - - - - 1,755.5
Amounts owing to subsidiary
companies 1,298.0 - - - - - 1,298.0
Derivative financial instruments:
Currency hedging contracts 14.5 - - - - - 14.5
Fuel hedging contracts 93.6 - - - - - 93.6
Interest rate swap contracts 13.0 - - - - - 13.0
3,212.0 928.0 - - - - 4,140.0