Singapore Airlines 2010 Annual Report Download - page 67
Download and view the complete annual report
Please find page 67 of the 2010 Singapore Airlines annual report below. You can navigate through the pages in the report by either clicking on the pages listed below, or by using the keyword search tool below to find specific information within the annual report.-
 1
1 -
2
-
3
-
4
-
5
-
6
-
7
-
8
-
9
-
10
-
11
-
12
-
13
-
14
-
15
-
16
-
17
-
18
-
19
-
20
-
21
-
22
-
23
-
24
-
25
-
26
-
27
-
28
-
29
-
30
-
31
-
32
-
33
-
34
-
35
-
36
-
37
-
38
-
39
-
40
-
41
-
42
-
43
-
44
-
45
-
46
-
47
-
48
-
49
-
50
-
51
-
52
-
53
-
54
-
55
-
56
-
 57
57 -
 58
58 -
 59
59 -
 60
60 -
 61
61 -
 62
62 -
 63
63 -
 64
64 -
 65
65 -
 66
66 -
 67
67 -
 68
68 -
 69
69 -
 70
70 -
 71
71 -
 72
72 -
 73
73 -
 74
74 -
 75
75 -
 76
76 -
 77
77 -
78
-
79
-
80
-
81
-
82
-
83
-
84
-
85
-
86
-
87
-
88
-
89
-
90
-
91
-
92
-
93
-
94
-
95
-
96
-
97
-
98
-
99
-
100
-
101
-
102
-
103
-
104
-
105
-
106
-
107
-
108
-
109
-
110
-
111
-
112
-
113
-
114
-
115
-
116
-
117
-
118
-
119
-
120
-
121
-
122
-
123
-
124
-
125
-
126
-
127
-
128
-
129
-
130
-
131
-
132
-
133
-
134
-
135
-
136
-
137
-
138
-
139
-
140
-
141
-
142
-
143
-
144
-
145
-
146
-
147
-
148
-
149
-
150
-
151
-
152
-
153
-
154
-
155
-
156
-
157
-
158
-
159
-
160
-
161
-
162
-
163
-
164
-
165
-
166
-
167
-
168
-
169
-
170
-
171
-
172
-
173
-
174
-
175
-
176
-
177
-
178
-
179
-
180
-
181
-
182
-
183
-
184
-
185
-
186
-
187
-
188
-
189
-
190
-
191
-
192
-
193
-
194
-
195
-
196
-
197
-
198
-
199
-
200
-
201
-
202
-
203
-
204
-
205
-
206
-
207
-
208
-
209
-
210
-
211
-
212
-
213
-
214
 |
 |
ANNUAL REPORT 2009/10
65
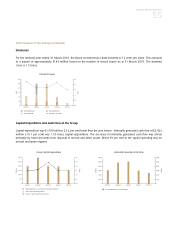
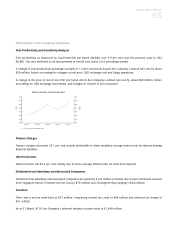
Performance of the Company (continued)
Fuel Productivity and Sensitivity Analysis
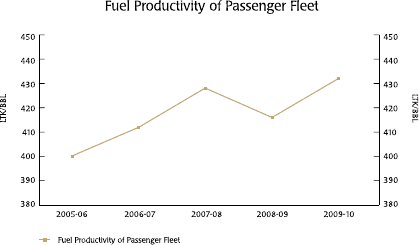
Fuel productivity as measured by load tonne-km per barrel (ltk/BBL) rose 3.9 per cent over the previous year to 432
ltk/BBL. This was attributed to an improvement in overall load factor (+2.9 percentage points).
A change in fuel productivity (passenger aircraft) of 1.0 per cent would impact the Company’s annual fuel cost by about
$30 million, before accounting for changes in fuel price, USD exchange rate and flying operations.
A change in the price of fuel of one USD per barrel affects the Company’s annual fuel cost by about $38 million, before
accounting for USD exchange movements, and changes in volume of fuel consumed.
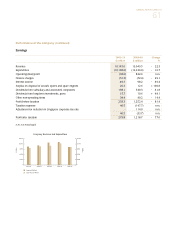
Finance Charges
Finance charges decreased 29.1 per cent, mainly attributable to lower weighted average interest rate for interest bearing
financial liabilities.
Interest Income
Interest income fell 49.4 per cent, mainly due to lower average interest rates on short-term deposits.
Dividends from Subsidiary and Associated Companies
Dividends from subsidiary and associated companies decreased by $142 million, primarily due to lower dividends received
from Singapore Airport Terminal Services Group (-$70 million) and SIA Engineering Company (-$44 million).
Taxation
There was a net tax write-back of $47 million, comprising current tax credit of $88 million and deferred tax charge of
$41 million.
As at 31 March 2010, the Company’s deferred taxation account stood at $1,946 million.