Singapore Airlines 2010 Annual Report Download - page 161
Download and view the complete annual report
Please find page 161 of the 2010 Singapore Airlines annual report below. You can navigate through the pages in the report by either clicking on the pages listed below, or by using the keyword search tool below to find specific information within the annual report.-
 1
1 -
2
-
3
-
4
-
5
-
6
-
7
-
8
-
9
-
10
-
11
-
12
-
13
-
14
-
15
-
16
-
17
-
18
-
19
-
20
-
21
-
22
-
23
-
24
-
25
-
26
-
27
-
28
-
29
-
30
-
31
-
32
-
33
-
34
-
35
-
36
-
37
-
38
-
39
-
40
-
41
-
42
-
43
-
44
-
45
-
46
-
47
-
48
-
49
-
50
-
51
-
52
-
53
-
54
-
55
-
56
-
57
-
58
-
59
-
60
-
61
-
62
-
63
-
64
-
65
-
66
-
67
-
68
-
69
-
70
-
71
-
72
-
73
-
74
-
75
-
76
-
77
-
78
-
79
-
80
-
81
-
82
-
83
-
84
-
85
-
86
-
87
-
88
-
89
-
90
-
91
-
92
-
93
-
94
-
95
-
96
-
97
-
98
-
99
-
100
-
101
-
102
-
103
-
104
-
105
-
106
-
107
-
108
-
109
-
110
-
111
-
112
-
113
-
114
-
115
-
116
-
117
-
118
-
119
-
120
-
121
-
122
-
123
-
124
-
125
-
126
-
127
-
128
-
129
-
130
-
131
-
132
-
133
-
134
-
135
-
136
-
137
-
138
-
139
-
140
-
141
-
142
-
143
-
144
-
145
-
146
-
147
-
148
-
149
-
150
-
 151
151 -
 152
152 -
 153
153 -
 154
154 -
 155
155 -
 156
156 -
 157
157 -
 158
158 -
 159
159 -
 160
160 -
 161
161 -
 162
162 -
 163
163 -
 164
164 -
 165
165 -
 166
166 -
 167
167 -
 168
168 -
 169
169 -
 170
170 -
 171
171 -
172
-
173
-
174
-
175
-
176
-
177
-
178
-
179
-
180
-
181
-
182
-
183
-
184
-
185
-
186
-
187
-
188
-
189
-
190
-
191
-
192
-
193
-
194
-
195
-
196
-
197
-
198
-
199
-
200
-
201
-
202
-
203
-
204
-
205
-
206
-
207
-
208
-
209
-
210
-
211
-
212
-
213
-
214
 |
 |

ANNUAL REPORT 2009/10
159
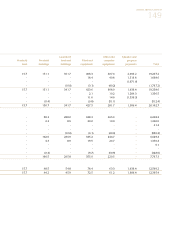
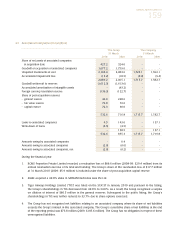
23 Associated Companies (in $ million)
The Group The Company
31 March 31 March
2010 2009 2010 2009
Share of net assets of associated companies
at acquisition date 427.2 324.0 - -
Goodwill on acquisition of associated companies 1,677.2 1,759.6 - -
Unquoted investments at cost 2,104.4 2,083.6 1,725.1 1,592.1
Accumulated impairment loss (15.2) (18.5) (9.4) (9.4)
2,089.2 2,065.1 1,715.7 1,582.7
Goodwill written-off to reserves (1,612.3) (1,613.0) - -
Accumulated amortisation of intangible assets - (43.2) - -
Foreign currency translation reserve (136.3) (122.7) - -
Share of post-acquisition reserves
- general reserve 46.9 268.6 - -
- fair value reserve 72.8 72.0 - -
- capital reserve 72.3 90.0 - -
532.6 716.8 1,715.7 1,582.7
Loans to associated companies 4.5 143.0 - 137.1
Write-down of loans (4.5) (4.5) - -
- 138.5 - 137.1
532.6 855.3 1,715.7 1,719.8
Amounts owing by associated companies - 0.4 - -
Amounts owing to associated companies (2.0) (0.6) - -
Amounts owing to associated companies, net (2.0) (0.2) - -
During the financial year:
1. RCMS Properties Private Limited recorded a revaluation loss of $88.6 million (2008-09: $29.4 million) from its
annual revaluation exercise of its land and building. The Group’s share of the revaluation loss of $17.7 million
at 31 March 2010 (2009: $5.9 million) is included under the share of post-acquisition capital reserve.
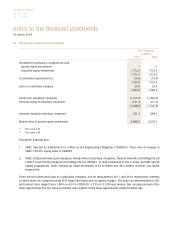
2. SIAEC acquired a 49.0% stake in SAFRAN Electronics Asia Pte Ltd.
3. Tiger Airways Holdings Limited (“TIG”) was listed on the SGX-ST in January 2010 and pursuant to the listing,
the Group’s shareholdings in TIG decreased from 49.0% to 34.0%. As a result, the Group recognised a surplus
on dilution of interest of $80.5 million in the general reserves. Subsequent to the public listing, the Group’s
shareholdings in TIG was further reduced to 33.7% due to share options exercised.
4. The Group has not recognised net liabilities relating to an associated company where its share of net liabilities
exceeds the Group’s interest in this associated company. The Group’s cumulative share of net liabilities at the end
of the reporting period was $73.8 million (2009: $185.6 million). The Group has no obligation in respect of these
unrecognised liabilities.