Singapore Airlines 2010 Annual Report Download - page 58
Download and view the complete annual report
Please find page 58 of the 2010 Singapore Airlines annual report below. You can navigate through the pages in the report by either clicking on the pages listed below, or by using the keyword search tool below to find specific information within the annual report.-
 1
1 -
2
-
3
-
4
-
5
-
6
-
7
-
8
-
9
-
10
-
11
-
12
-
13
-
14
-
15
-
16
-
17
-
18
-
19
-
20
-
21
-
22
-
23
-
24
-
25
-
26
-
27
-
28
-
29
-
30
-
31
-
32
-
33
-
34
-
35
-
36
-
37
-
38
-
39
-
40
-
41
-
42
-
43
-
44
-
45
-
46
-
47
-
 48
48 -
 49
49 -
 50
50 -
 51
51 -
 52
52 -
 53
53 -
 54
54 -
 55
55 -
 56
56 -
 57
57 -
 58
58 -
 59
59 -
 60
60 -
 61
61 -
 62
62 -
 63
63 -
 64
64 -
 65
65 -
 66
66 -
 67
67 -
 68
68 -
69
-
70
-
71
-
72
-
73
-
74
-
75
-
76
-
77
-
78
-
79
-
80
-
81
-
82
-
83
-
84
-
85
-
86
-
87
-
88
-
89
-
90
-
91
-
92
-
93
-
94
-
95
-
96
-
97
-
98
-
99
-
100
-
101
-
102
-
103
-
104
-
105
-
106
-
107
-
108
-
109
-
110
-
111
-
112
-
113
-
114
-
115
-
116
-
117
-
118
-
119
-
120
-
121
-
122
-
123
-
124
-
125
-
126
-
127
-
128
-
129
-
130
-
131
-
132
-
133
-
134
-
135
-
136
-
137
-
138
-
139
-
140
-
141
-
142
-
143
-
144
-
145
-
146
-
147
-
148
-
149
-
150
-
151
-
152
-
153
-
154
-
155
-
156
-
157
-
158
-
159
-
160
-
161
-
162
-
163
-
164
-
165
-
166
-
167
-
168
-
169
-
170
-
171
-
172
-
173
-
174
-
175
-
176
-
177
-
178
-
179
-
180
-
181
-
182
-
183
-
184
-
185
-
186
-
187
-
188
-
189
-
190
-
191
-
192
-
193
-
194
-
195
-
196
-
197
-
198
-
199
-
200
-
201
-
202
-
203
-
204
-
205
-
206
-
207
-
208
-
209
-
210
-
211
-
212
-
213
-
214
 |
 |

SINGAPORE AIRLINES
56
financial review
Performance of the Group (continued)
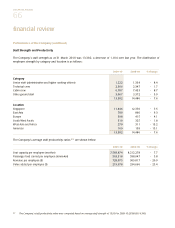
Statements of Value Added and its Distribution
2009-10 2008-09
$ million $ million
Total revenue 12,707.3 15,996.3
Less: Purchase of goods and services (8,722.1) (10,810.2)
3,985.2 5,186.1
Add:
Interest income 49.5 96.0
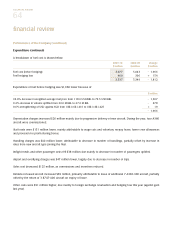
Surplus on disposal of aircraft, spares and spare engines 25.4 60.6
Dividends from long-term investments, gross 33.0 23.7
Other non-operating items 34.2 29.4
Share of profits of joint venture companies 56.1 63.9
Share of profits of associated companies 93.0 111.1
Total value added for distribution 4,276.4 5,570.8
Applied as follows:
To employees
- Salaries and other staff cost 2,159.4 2,545.9
To government:
- Corporation taxes 6.0 190.0
To suppliers of capital:
- Interim and proposed dividends 143.0 473.6
- Finance charges 68.9 89.7
- Minority interest 63.7 85.3
Retained for future capital requirements:
- Depreciation and amortisation 1,762.6 1,736.6
- Retained profit R4 72.8 449.7
Total value added 4,276.4 5,570.8
Value added per $ revenue ($) 0.34 0.35
Value added per $ employment cost ($) 1.98 2.19
Value added per $ investment in property, plant and equipment ($) 0.17 0.22
Value added is a measure of wealth created. The statement above shows the Group’s valued added and its distribution by
way of payments to employees, government, and to those who have provided capital. It also indicates the portion retained
in the business for future capital requirements.
R4 Retained profit excludes tax write-back as a result of the reduction in corporate tax rate of $138.2 million for 2008-09. If tax write-back was
included, retained profit for 2008-09 would be $587.9 million.